PART 58 - AMBIENT AIR QUALITY SURVEILLANCE
Source:
44 FR 27571, May 10, 1979; 59 FR 41628, Aug. 12, 1994, unless otherwise noted.
Subpart A - General Provisions
Source:
71 FR 61296, Oct. 17, 2006, unless otherwise noted.
§ 58.1 Definitions.
As used in this part, all terms not defined herein have the meaning given them in the Clean Air Act.
AADT means the annual average daily traffic.
Act means the Clean Air Act as amended (42 U.S.C. 7401, et seq.)
Additive and multiplicative bias means the linear regression intercept and slope of a linear plot fitted to corresponding candidate and reference method mean measurement data pairs.
Administrator means the Administrator of the Environmental Protection Agency (EPA) or his or her authorized representative.
Air quality system (AQS) means the EPA's computerized system for storing and reporting of information relating to ambient air quality data.
Approved regional method (ARM) means a continuous PM2.5 method that has been approved specifically within a state or local air monitoring network for purposes of comparison to the NAAQS and to meet other monitoring objectives.
AQCR means air quality control region.
Area-wide means all monitors sited at neighborhood, urban, and regional scales, as well as those monitors sited at either micro- or middle-scale that are representative of many such locations in the same CBSA.
Certifying agency means a state, local, or tribal agency responsible for meeting the data certification requirements in accordance with § 58.15 for a unique set of monitors.
Chemical Speciation Network (CSN) includes Speciation Trends Network stations (STN) as specified in paragraph 4.7.4 of appendix D of this part and supplemental speciation stations that provide chemical species data of fine particulate.
CO means carbon monoxide.
Combined statistical area (CSA) is defined by the U.S. Office of Management and Budget as a geographical area consisting of two or more adjacent Core Based Statistical Areas (CBSA) with employment interchange of at least 15 percent. Combination is automatic if the employment interchange is 25 percent and determined by local opinion if more than 15 but less than 25 percent.
Core-based statistical area (CBSA) is defined by the U.S. Office of Management and Budget, as a statistical geographic entity consisting of the county or counties associated with at least one urbanized area/urban cluster of at least 10,000 population, plus adjacent counties having a high degree of social and economic integration. Metropolitan Statistical Areas (MSAs) and micropolitan statistical areas are the two categories of CBSA (metropolitan areas have populations greater than 50,000; and micropolitan areas have populations between 10,000 and 50,000). In the case of very large cities where two or more CBSAs are combined, these larger areas are referred to as combined statistical areas (CSAs)
Corrected concentration pertains to the result of an accuracy or precision assessment test of an open path analyzer in which a high-concentration test or audit standard gas contained in a short test cell is inserted into the optical measurement beam of the instrument. When the pollutant concentration measured by the analyzer in such a test includes both the pollutant concentration in the test cell and the concentration in the atmosphere, the atmospheric pollutant concentration must be subtracted from the test measurement to obtain the corrected concentration test result. The corrected concentration is equal to the measured concentration minus the average of the atmospheric pollutant concentrations measured (without the test cell) immediately before and immediately after the test.
Design value means the calculated concentration according to the applicable appendix of part 50 of this chapter for the highest site in an attainment or nonattainment area.
EDO means environmental data operations.
Effective concentration pertains to testing an open path analyzer with a high-concentration calibration or audit standard gas contained in a short test cell inserted into the optical measurement beam of the instrument. Effective concentration is the equivalent ambient-level concentration that would produce the same spectral absorbance over the actual atmospheric monitoring path length as produced by the high-concentration gas in the short test cell. Quantitatively, effective concentration is equal to the actual concentration of the gas standard in the test cell multiplied by the ratio of the path length of the test cell to the actual atmospheric monitoring path length.
Federal equivalent method (FEM) means a method for measuring the concentration of an air pollutant in the ambient air that has been designated as an equivalent method in accordance with part 53 of this chapter; it does not include a method for which an equivalent method designation has been canceled in accordance with § 53.11 or § 53.16.
Federal reference method (FRM) means a method of sampling and analyzing the ambient air for an air pollutant that is specified as a reference method in an appendix to part 50 of this chapter, or a method that has been designated as a reference method in accordance with this part; it does not include a method for which a reference method designation has been canceled in accordance with § 53.11 or § 53.16 of this chapter.
HNO3 means nitric acid.
Implementation plan means an implementation plan approved or promulgated by the EPA pursuant to section 110 of the Act.
Local agency means any local government agency, other than the state agency, which is charged by a state with the responsibility for carrying out a portion of the annual monitoring network plan required by § 58.10.
Meteorological measurements means measurements of wind speed, wind direction, barometric pressure, temperature, relative humidity, solar radiation, ultraviolet radiation, and/or precipitation that occur at SLAMS stations including the NCore and PAMS networks.
Metropolitan Statistical Area (MSA) means a CBSA associated with at least one urbanized area of 50,000 population or greater. The central-county, plus adjacent counties with a high degree of integration, comprise the area.
Monitor means an instrument, sampler, analyzer, or other device that measures or assists in the measurement of atmospheric air pollutants and which is acceptable for use in ambient air surveillance under the applicable provisions of appendix C to this part.
Monitoring agency means a state, local or tribal agency responsible for meeting the requirements of this part.
Monitoring organization means a monitoring agency responsible for operating a monitoring site for which the quality assurance regulations apply.
Monitoring path for an open path analyzer means the actual path in space between two geographical locations over which the pollutant concentration is measured and averaged.
Monitoring path length of an open path analyzer means the length of the monitoring path in the atmosphere over which the average pollutant concentration measurement (path-averaged concentration) is determined. See also, optical measurement path length.
Monitoring planning area (MPA) means a contiguous geographic area with established, well-defined boundaries, such as a CBSA, county or state, having a common area that is used for planning monitoring locations for PM2.5. A MPA may cross state boundaries, such as the Philadelphia PA-NJ MSA, and be further subdivided into community monitoring zones. The MPAs are generally oriented toward CBSAs or CSAs with populations greater than 200,000, but for convenience, those portions of a state that are not associated with CBSAs can be considered as a single MPA.
NATTS means the national air toxics trends stations. This network provides hazardous air pollution ambient data.
NCore means the National Core multipollutant monitoring stations. Monitors at these sites are required to measure particles (PM2.5 speciated PM2.5, PM10-2.5), O3, SO2, CO, nitrogen oxides (NO/NOy), and meteorology (wind speed, wind direction, temperature, relative humidity).
Near-road monitor means any approved monitor meeting the applicable specifications described in 40 CFR part 58, appendix D (sections 4.2.1, 4.3.2, 4.7.1(b)(2)) and appendix E (section 6.4(a), Table E-4) for near-road measurement of PM2.5, CO, or NO2.
Network means all stations of a given type or types.
Network Plan means the Annual Monitoring Network Plan described in § 58.10.
NH3 means ammonia.
NO2 means nitrogen dioxide.
NO means nitrogen oxide.
NOX means the sum of the concentrations of NO2 and NO.
NOy means the sum of all total reactive nitrogen oxides, including NO, NO2, and other nitrogen oxides referred to as NOZ.
O3 means ozone.
Open path analyzer means an automated analytical method that measures the average atmospheric pollutant concentration in situ along one or more monitoring paths having a monitoring path length of 5 meters or more and that has been designated as a reference or equivalent method under the provisions of part 53 of this chapter.
Optical measurement path length means the actual length of the optical beam over which measurement of the pollutant is determined. The path-integrated pollutant concentration measured by the analyzer is divided by the optical measurement path length to determine the path-averaged concentration. Generally, the optical measurement path length is:
(1) Equal to the monitoring path length for a (bistatic) system having a transmitter and a receiver at opposite ends of the monitoring path;
(2) Equal to twice the monitoring path length for a (monostatic) system having a transmitter and receiver at one end of the monitoring path and a mirror or retroreflector at the other end; or
(3) Equal to some multiple of the monitoring path length for more complex systems having multiple passes of the measurement beam through the monitoring path.
PAMS means photochemical assessment monitoring stations.
Pb means lead.
PM means particulate matter, including but not limited to PM10, PM10C, PM2.5, and PM10-2.5.
PM2.5 means particulate matter with an aerodynamic diameter less than or equal to a nominal 2.5 micrometers as measured by a reference method based on appendix L of part 50 and designated in accordance with part 53 of this chapter, by an equivalent method designated in accordance with part 53, or by an approved regional method designated in accordance with appendix C to this part.
PM10 means particulate matter with an aerodynamic diameter less than or equal to a nominal 10 micrometers as measured by a reference method based on appendix J of part 50 of this chapter and designated in accordance with part 53 of this chapter or by an equivalent method designated in accordance with part 53.
PM10C means particulate matter with an aerodynamic diameter less than or equal to a nominal 10 micrometers as measured by a reference method based on appendix O of part 50 of this chapter and designated in accordance with part 53 of this chapter or by an equivalent method designated in accordance with part 53.
PM10−2.5 means particulate matter with an aerodynamic diameter less than or equal to a nominal 10 micrometers and greater than a nominal 2.5 micrometers as measured by a reference method based on appendix O to part 50 of this chapter and designated in accordance with part 53 of this chapter or by an equivalent method designated in accordance with part 53.
Point analyzer means an automated analytical method that measures pollutant concentration in an ambient air sample extracted from the atmosphere at a specific inlet probe point, and that has been designated as a reference or equivalent method in accordance with part 53 of this chapter.
Primary monitor means the monitor identified by the monitoring organization that provides concentration data used for comparison to the NAAQS. For any specific site, only one monitor for each pollutant can be designated in AQS as primary monitor for a given period of time. The primary monitor identifies the default data source for creating a combined site record for purposes of NAAQS comparisons.
Primary quality assurance organization (PQAO) means a monitoring organization, a group of monitoring organizations or other organization that is responsible for a set of stations that monitor the same pollutant and for which data quality assessments can be pooled. Each criteria pollutant sampler/monitor at a monitoring station must be associated with only one PQAO.
Probe means the actual inlet where an air sample is extracted from the atmosphere for delivery to a sampler or point analyzer for pollutant analysis.
PSD monitoring network means a set of stations that provide concentration information for a specific PSD permit.
PSD monitoring organization means a source owner/operator, a government agency, or a contractor of the source or agency that operates an ambient air pollution monitoring network for PSD purposes.
PSD station means any station operated for the purpose of establishing the effect on air quality of the emissions from a proposed source for purposes of prevention of significant deterioration as required by § 51.24(n) of this chapter.
Regional Administrator means the Administrator of one of the ten EPA Regional Offices or his or her authorized representative.
Reporting organization means an entity, such as a state, local, or tribal monitoring agency, that reports air quality data to the EPA.
Site means a geographic location. One or more stations may be at the same site.
SLAMS means state or local air monitoring stations. The SLAMS include the ambient air quality monitoring sites and monitors that are required by appendix D of this part and are needed for the monitoring objectives of appendix D, including NAAQS comparisons, but may serve other data purposes. The SLAMS includes NCore, PAMS, CSN, and all other state or locally operated criteria pollutant monitors, operated in accordance to this part, that have not been designated and approved by the Regional Administrator as SPM stations in an annual monitoring network plan.
SO2 means sulfur dioxide.
Special purpose monitor (SPM) station means a monitor included in an agency's monitoring network that the agency has designated as a special purpose monitor station in its annual monitoring network plan and in the AQS, and which the agency does not count when showing compliance with the minimum requirements of this subpart for the number and siting of monitors of various types. Any SPM operated by an air monitoring agency must be included in the periodic assessments and annual monitoring network plan required by § 58.10 and approved by the Regional Administrator.
State agency means the air pollution control agency primarily responsible for development and implementation of a State Implementation Plan under the Act.
Station means a single monitor, or a group of monitors, located at a particular site.
STN station means a PM2.5 chemical speciation station designated to be part of the speciation trends network. This network provides chemical species data of fine particulate.
Supplemental speciation station means a PM2.5 chemical speciation station that is operated for monitoring agency needs and not part of the STN.
Traceable means that a local standard has been compared and certified, either directly or via not more than one intermediate standard, to a National Institute of Standards and Technology (NIST)-certified primary standard such as a NIST-traceable Reference Material (NTRM) or a NIST-certified Gas Manufacturer's Internal Standard (GMIS).
TSP (total suspended particulates) means particulate matter as measured by the method described in appendix B of Part 50.
Urbanized area means an area with a minimum residential population of at least 50,000 people and which generally includes core census block groups or blocks that have a population density of at least 1,000 people per square mile and surrounding census blocks that have an overall density of at least 500 people per square mile. The Census Bureau notes that under certain conditions, less densely settled territory may be part of each Urbanized Area.
VOCs means volatile organic compounds.
[81 FR 17276, Mar. 28, 2016]
§ 58.2 Purpose.
(a) This part contains requirements for measuring ambient air quality and for reporting ambient air quality data and related information. The monitoring criteria pertain to the following areas:
(1) Quality assurance procedures for monitor operation and data handling.
(2) Methodology used in monitoring stations.
(3) Operating schedule.
(4) Siting parameters for instruments or instrument probes.
(5) Minimum ambient air quality monitoring network requirements used to provide support to the State implementation plans (SIP), national air quality assessments, and policy decisions. These minimums are described as part of the network design requirements, including minimum numbers and placement of monitors of each type.
(6) Air quality data reporting, and requirements for the daily reporting of an index of ambient air quality.
(b) The requirements pertaining to provisions for an air quality surveillance system in the SIP are contained in this part.
(c) This part also acts to establish a national ambient air quality monitoring network for the purpose of providing timely air quality data upon which to base national assessments and policy decisions.
§ 58.3 Applicability.
This part applies to:
(a) State air pollution control agencies.
(b) Any local air pollution control agency to which the State has delegated authority to operate a portion of the State's SLAMS network.
(c) Owners or operators of proposed sources.
Subpart B - Monitoring Network
Source:
71 FR 61298, Oct. 17, 2006, unless otherwise noted.
§ 58.10 Annual monitoring network plan and periodic network assessment.
(a)
(1) Beginning July 1, 2007, the state, or where applicable local, agency shall submit to the Regional Administrator an annual monitoring network plan which shall provide for the documentation of the establishment and maintenance of an air quality surveillance system that consists of a network of SLAMS monitoring stations that can include FRM, FEM, and ARM monitors that are part of SLAMS, NCore, CSN, PAMS, and SPM stations. The plan shall include a statement of whether the operation of each monitor meets the requirements of appendices A, B, C, D, and E of this part, where applicable. The Regional Administrator may require additional information in support of this statement. The annual monitoring network plan must be made available for public inspection and comment for at least 30 days prior to submission to the EPA and the submitted plan shall include and address, as appropriate, any received comments.
(2) Any annual monitoring network plan that proposes network modifications (including new or discontinued monitoring sites, new determinations that data are not of sufficient quality to be compared to the NAAQS, and changes in identification of monitors as suitable or not suitable for comparison against the annual PM2.5 NAAQS) to SLAMS networks is subject to the approval of the EPA Regional Administrator, who shall approve or disapprove the plan within 120 days of submission of a complete plan to the EPA.
(3) The plan for establishing required NCore multipollutant stations shall be submitted to the Administrator not later than July 1, 2009. The plan shall provide for all required stations to be operational by January 1, 2011.
(4) A plan for establishing source-oriented Pb monitoring sites in accordance with the requirements of appendix D to this part for Pb sources emitting 1.0 tpy or greater shall be submitted to the EPA Regional Administrator no later than July 1, 2009, as part of the annual network plan required in paragraph (a)(1) of this section. The plan shall provide for the required source-oriented Pb monitoring sites for Pb sources emitting 1.0 tpy or greater to be operational by January 1, 2010. A plan for establishing source-oriented Pb monitoring sites in accordance with the requirements of appendix D to this part for Pb sources emitting equal to or greater than 0.50 tpy but less than 1.0 tpy shall be submitted to the EPA Regional Administrator no later than July 1, 2011. The plan shall provide for the required source-oriented Pb monitoring sites for Pb sources emitting equal to or greater than 0.50 tpy but less than 1.0 tpy to be operational by December 27, 2011.
(5)
(i) A plan for establishing or identifying an area-wide NO2 monitor, in accordance with the requirements of Appendix D, section 4.3.3 to this part, shall be submitted as part of the Annual Monitoring Network Plan to the EPA Regional Administrator by July 1, 2012. The plan shall provide for these required monitors to be operational by January 1, 2013.
(ii) A plan for establishing or identifying any NO2 monitor intended to characterize vulnerable and susceptible populations, as required in Appendix D, section 4.3.4 to this part, shall be submitted as part of the Annual Monitoring Network Plan to the EPA Regional Administrator by July 1, 2012. The plan shall provide for these required monitors to be operational by January 1, 2013.
(iii) A plan for establishing a single near-road NO2 monitor in CBSAs having 1,000,000 or more persons, in accordance with the requirements of Appendix D, section 4.3.2 to this part, shall be submitted as part of the Annual Monitoring Network Plan to the EPA Regional Administrator by July 1, 2013. The plan shall provide for these required monitors to be operational by January 1, 2014.
(iv) A plan for establishing a second near-road NO2 monitor in any CBSA with a population of 2,500,000 persons or more, or a second monitor in any CBSA with a population of 1,000,000 or more persons that has one or more roadway segments with 250,000 or greater AADT counts, in accordance with the requirements of appendix D, section 4.3.2 to this part, shall be submitted as part of the Annual Monitoring Network Plan to the EPA Regional Administrator by July 1, 2014. The plan shall provide for these required monitors to be operational by January 1, 2015.
(6) A plan for establishing SO2 monitoring sites in accordance with the requirements of appendix D to this part shall be submitted to the EPA Regional Administrator by July 1, 2011 as part of the annual network plan required in paragraph (a) (1). The plan shall provide for all required SO2 monitoring sites to be operational by January 1, 2013.
(7) A plan for establishing CO monitoring sites in accordance with the requirements of appendix D to this part shall be submitted to the EPA Regional Administrator. Plans for required CO monitors shall be submitted at least six months prior to the date such monitors must be established as required by section 58.13.
(8)
(i) A plan for establishing near-road PM2.5 monitoring sites in CBSAs having 2.5 million or more persons, in accordance with the requirements of appendix D to this part, shall be submitted as part of the annual monitoring network plan to the EPA Regional Administrator by July 1, 2014. The plan shall provide for these required monitoring stations to be operational by January 1, 2015.
(ii) A plan for establishing near-road PM2.5 monitoring sites in CBSAs having 1 million or more persons, but less than 2.5 million persons, in accordance with the requirements of appendix D to this part, shall be submitted as part of the annual monitoring network plan to the EPA Regional Administrator by July 1, 2016. The plan shall provide for these required monitoring stations to be operational by January 1, 2017.
(9) The annual monitoring network plan shall provide for the required O3 sites to be operating on the first day of the applicable required O3 monitoring season in effect on January 1, 2017 as listed in Table D-3 of appendix D of this part.
(10) A plan for making Photochemical Assessment Monitoring Stations (PAMS) measurements, if applicable, in accordance with the requirements of appendix D paragraph 5(a) of this part shall be submitted to the EPA Regional Administrator no later than July 1, 2018. The plan shall provide for the required PAMS measurements to begin by June 1, 2019.
(11) An Enhanced Monitoring Plan for O3, if applicable, in accordance with the requirements of appendix D paragraph 5(h) of this part shall be submitted to the EPA Regional Administrator no later than October 1, 2019 or two years following the effective date of a designation to a classification of Moderate or above O3 nonattainment, whichever is later.
(12) A detailed description of the PAMS network being operated in accordance with the requirements of appendix D to this part shall be submitted as part of the annual monitoring network plan for review by the EPA Administrator. The PAMS Network Description described in section 5 of appendix D may be used to meet this requirement.
(b) The annual monitoring network plan must contain the following information for each existing and proposed site:
(1) The AQS site identification number.
(2) The location, including street address and geographical coordinates.
(3) The sampling and analysis method(s) for each measured parameter.
(4) The operating schedules for each monitor.
(5) Any proposals to remove or move a monitoring station within a period of 18 months following plan submittal.
(6) The monitoring objective and spatial scale of representativeness for each monitor as defined in appendix D to this part.
(7) The identification of any sites that are suitable and sites that are not suitable for comparison against the annual PM2.5 NAAQS as described in § 58.30.
(8) The MSA, CBSA, CSA or other area represented by the monitor.
(9) The designation of any Pb monitors as either source-oriented or non-source-oriented according to Appendix D to 40 CFR part 58.
(10) Any source-oriented monitors for which a waiver has been requested or granted by the EPA Regional Administrator as allowed for under paragraph 4.5(a)(ii) of Appendix D to 40 CFR part 58.
(11) Any source-oriented or non-source-oriented site for which a waiver has been requested or granted by the EPA Regional Administrator for the use of Pb-PM10 monitoring in lieu of Pb-TSP monitoring as allowed for under paragraph 2.10 of Appendix C to 40 CFR part 58.
(12) The identification of required NO2 monitors as near-road, area-wide, or vulnerable and susceptible population monitors in accordance with Appendix D, section 4.3 of this part.
(13) The identification of any PM2.5 FEMs and/or ARMs used in the monitoring agency's network where the data are not of sufficient quality such that data are not to be compared to the NAAQS. For required SLAMS where the agency identifies that the PM2.5 Class III FEM or ARM does not produce data of sufficient quality for comparison to the NAAQS, the monitoring agency must ensure that an operating FRM or filter-based FEM meeting the sample frequency requirements described in § 58.12 or other Class III PM2.5 FEM or ARM with data of sufficient quality is operating and reporting data to meet the network design criteria described in appendix D to this part.
(c) The annual monitoring network plan must document how state and local agencies provide for the review of changes to a PM2.5 monitoring network that impact the location of a violating PM2.5 monitor. The affected state or local agency must document the process for obtaining public comment and include any comments received through the public notification process within their submitted plan.
(d) The state, or where applicable local, agency shall perform and submit to the EPA Regional Administrator an assessment of the air quality surveillance system every 5 years to determine, at a minimum, if the network meets the monitoring objectives defined in appendix D to this part, whether new sites are needed, whether existing sites are no longer needed and can be terminated, and whether new technologies are appropriate for incorporation into the ambient air monitoring network. The network assessment must consider the ability of existing and proposed sites to support air quality characterization for areas with relatively high populations of susceptible individuals (e.g., children with asthma), and, for any sites that are being proposed for discontinuance, the effect on data users other than the agency itself, such as nearby states and tribes or health effects studies. The state, or where applicable local, agency must submit a copy of this 5-year assessment, along with a revised annual network plan, to the Regional Administrator. The assessments are due every five years beginning July 1, 2010.
(e) All proposed additions and discontinuations of SLAMS monitors in annual monitoring network plans and periodic network assessments are subject to approval according to § 58.14.
[71 FR 61298, Oct. 17, 2006, as amended at 72 FR 32210, June 12, 2007; 73 FR 67059, Nov. 12, 2008; 73 FR 77517, Dec. 19, 2008; 75 FR 6534, Feb. 9, 2010; 75 FR 35601, June 22, 2010; 75 FR 81137, Dec. 27, 2010; 76 FR 54341, Aug. 31, 2011; 78 FR 16188, Mar. 14, 2013; 78 FR 3282, Jan. 15, 2013; 80 FR 65466, Oct. 26, 2015; 81 FR 17279, Mar. 28, 2016; 81 FR 96388, Dec. 30, 2016]
§ 58.11 Network technical requirements.
(a)
(1) State and local governments shall follow the applicable quality assurance criteria contained in appendix A to this part when operating the SLAMS networks.
(2) Beginning January 1, 2009, State and local governments shall follow the quality assurance criteria contained in appendix A to this part that apply to SPM sites when operating any SPM site which uses a FRM, FEM, or ARM and meets the requirements of appendix E to this part, unless the Regional Administrator approves an alternative to the requirements of appendix A with respect to such SPM sites because meeting those requirements would be physically and/or financially impractical due to physical conditions at the monitoring site and the requirements are not essential to achieving the intended data objectives of the SPM site. Alternatives to the requirements of appendix A may be approved for an SPM site as part of the approval of the annual monitoring plan, or separately.
(3) The owner or operator of an existing or a proposed source shall follow the quality assurance criteria in appendix B to this part that apply to PSD monitoring when operating a PSD site.
(b) State and local governments must follow the criteria in appendix C to this part to determine acceptable monitoring methods or instruments for use in SLAMS networks. Appendix C criteria are optional at SPM stations.
(c) State and local governments must follow the network design criteria contained in appendix D to this part in designing and maintaining the SLAMS stations. The final network design and all changes in design are subject to approval of the Regional Administrator. NCore and STN network design and changes are also subject to approval of the Administrator. Changes in SPM stations do not require approvals, but a change in the designation of a monitoring site from SLAMS to SPM requires approval of the Regional Administrator.
(d) State and local governments must follow the criteria contained in appendix E to this part for siting monitor inlets, paths or probes at SLAMS stations. Appendix E adherence is optional for SPM stations.
(e) State and local governments must assess data from Class III PM2.5 FEM and ARM monitors operated within their network using the performance criteria described in table C-4 to subpart C of part 53 of this chapter, for cases where the data are identified as not of sufficient comparability to a collocated FRM, and the monitoring agency requests that the FEM or ARM data should not be used in comparison to the NAAQS. These assessments are required in the monitoring agency's annual monitoring network plan described in § 58.10(b) for cases where the FEM or ARM is identified as not of sufficient comparability to a collocated FRM. For these collocated PM2.5 monitors the performance criteria apply with the following additional provisions:
(1) The acceptable concentration range (Rj), µg/m3 may include values down to 0 µg/m3.
(2) The minimum number of test sites shall be at least one; however, the number of test sites will generally include all locations within an agency's network with collocated FRMs and FEMs or ARMs.
(3) The minimum number of methods shall include at least one FRM and at least one FEM or ARM.
(4) Since multiple FRMs and FEMs may not be present at each site; the precision statistic requirement does not apply, even if precision data are available.
(5) All seasons must be covered with no more than thirty-six consecutive months of data in total aggregated together.
(6) The key statistical metric to include in an assessment is the bias (both additive and multiplicative) of the PM2.5 continuous FEM(s) compared to a collocated FRM(s). Correlation is required to be reported in the assessment, but failure to meet the correlation criteria, by itself, is not cause to exclude data from a continuous FEM monitor.
[71 FR 61298, Oct. 17, 2006, as amended at 78 FR 3282, Jan. 15, 2013; 80 FR 65466, Oct. 26, 2015; 81 FR 17279, Mar. 28, 2016]
§ 58.12 Operating schedules.
State and local governments shall collect ambient air quality data at any SLAMS station on the following operational schedules:
(a) For continuous analyzers, consecutive hourly averages must be collected except during:
(1) Periods of routine maintenance,
(2) Periods of instrument calibration, or
(3) Periods or monitoring seasons exempted by the Regional Administrator.
(b) For Pb manual methods, at least one 24-hour sample must be collected every 6 days except during periods or seasons exempted by the Regional Administrator.
(c) For PAMS VOC samplers, samples must be collected as specified in section 5 of appendix D to this part. Area-specific PAMS operating schedules must be included as part of the PAMS network description and must be approved by the Regional Administrator.
(d) For manual PM2.5 samplers:
(1)
(i) Manual PM2.5 samplers at required SLAMS stations without a collocated continuously operating PM2.5 monitor must operate on at least a 1-in-3 day schedule unless a waiver for an alternative schedule has been approved per paragraph (d)(1)(ii) of this section.
(ii) For SLAMS PM2.5 sites with both manual and continuous PM2.5 monitors operating, the monitoring agency may request approval for a reduction to 1-in-6 day PM2.5 sampling or for seasonal sampling from the EPA Regional Administrator. Other requests for a reduction to 1-in-6 day PM2.5 sampling or for seasonal sampling may be approved on a case-by-case basis. The EPA Regional Administrator may grant sampling frequency reductions after consideration of factors (including but not limited to the historical PM2.5 data quality assessments, the location of current PM2.5 design value sites, and their regulatory data needs) if the Regional Administrator determines that the reduction in sampling frequency will not compromise data needed for implementation of the NAAQS. Required SLAMS stations whose measurements determine the design value for their area and that are within ±10 percent of the annual NAAQS, and all required sites where one or more 24-hour values have exceeded the 24-hour NAAQS each year for a consecutive period of at least 3 years are required to maintain at least a 1-in-3 day sampling frequency until the design value no longer meets these criteria for 3 consecutive years. A continuously operating FEM or ARM PM2.5 monitor satisfies this requirement unless it is identified in the monitoring agency's annual monitoring network plan as not appropriate for comparison to the NAAQS and the EPA Regional Administrator has approved that the data from that monitor may be excluded from comparison to the NAAQS.
(iii) Required SLAMS stations whose measurements determine the 24-hour design value for their area and whose data are within ±5 percent of the level of the 24-hour PM2.5 NAAQS must have an FRM or FEM operate on a daily schedule if that area's design value for the annual NAAQS is less than the level of the annual PM2.5 standard. A continuously operating FEM or ARM PM2.5 monitor satisfies this requirement unless it is identified in the monitoring agency's annual monitoring network plan as not appropriate for comparison to the NAAQS and the EPA Regional Administrator has approved that the data from that monitor may be excluded from comparison to the NAAQS. The daily schedule must be maintained until the referenced design value no longer meets these criteria for 3 consecutive years.
(iv) Changes in sampling frequency attributable to changes in design values shall be implemented no later than January 1 of the calendar year following the certification of such data as described in § 58.15.
(2) Manual PM2.5 samplers at NCore stations and required regional background and regional transport sites must operate on at least a 1-in-3 day sampling frequency.
(3) Manual PM2.5 speciation samplers at STN stations must operate on at least a 1-in-3 day sampling frequency unless a reduction in sampling frequency has been approved by the EPA Administrator based on factors such as area's design value, the role of the particular site in national health studies, the correlation of the site's species data with nearby sites, and presence of other leveraged measurements.
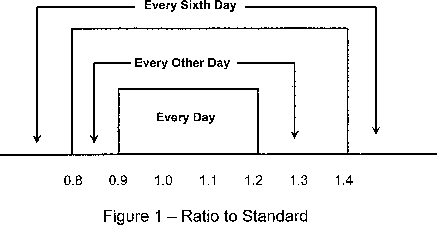
(e) For PM10 samplers, a 24-hour sample must be taken from midnight to midnight (local standard time) to ensure national consistency. The minimum monitoring schedule for the site in the area of expected maximum concentration shall be based on the relative level of that monitoring site concentration with respect to the 24-hour standard as illustrated in Figure 1. If the operating agency demonstrates by monitoring data that during certain periods of the year conditions preclude violation of the PM10 24-hour standard, the increased sampling frequency for those periods or seasons may be exempted by the Regional Administrator and permitted to revert back to once in six days. The minimum sampling schedule for all other sites in the area remains once every six days. No less frequently than as part of each 5-year network assessment, the most recent year of data must be considered to estimate the air quality status at the site near the area of maximum concentration. Statistical models such as analysis of concentration frequency distributions as described in “Guideline for the Interpretation of Ozone Air Quality Standards,” EPA-450/479-003, U.S. Environmental Protection Agency, Research Triangle Park, NC, January 1979, should be used. Adjustments to the monitoring schedule must be made on the basis of the 5-year network assessment. The site having the highest concentration in the most current year must be given first consideration when selecting the site for the more frequent sampling schedule. Other factors such as major change in sources of PM10 emissions or in sampling site characteristics could influence the location of the expected maximum concentration site. Also, the use of the most recent 3 years of data might, in some cases, be justified in order to provide a more representative database from which to estimate current air quality status and to provide stability to the network. This multiyear consideration reduces the possibility of an anomalous year biasing a site selected for accelerated sampling. If the maximum concentration site based on the most current year is not selected for the more frequent operating schedule, documentation of the justification for selection of an alternative site must be submitted to the Regional Office for approval during the 5-year network assessment process. Minimum data completeness criteria, number of years of data and sampling frequency for judging attainment of the NAAQS are discussed in appendix K of part 50 of this chapter.
(f) For manual PM10-2.5 samplers:
(1) Manual PM10-2.5 samplers at NCore stations must operate on at least a 1-in-3 day schedule at sites without a collocated continuously operating federal equivalent PM10-2.5 method that has been designated in accordance with part 53 of this chapter.
(2) [Reserved]
(g) For continuous SO2 analyzers, the maximum 5-minute block average concentration of the twelve 5-minute blocks in each hour must be collected except as noted in § 58.12 (a).
[71 FR 61298, Oct. 17, 2006, as amended at 72 FR 32210, June 12, 2007; 75 FR 35601, June 22, 2010; 78 FR 3282, Jan. 15, 2013; 81 FR 17279, Mar. 28, 2016]
§ 58.13 Monitoring network completion.
(a) The network of NCore multipollutant sites must be physically established no later than January 1, 2011, and at that time, operating under all of the requirements of this part, including the requirements of appendices A, C, D, E, and G to this part. NCore sites required to conduct Pb monitoring as required under 40 CFR part 58 appendix D paragraph 3(b), or approved alternative non-source-oriented Pb monitoring sites, shall begin Pb monitoring in accordance with all of the requirements of this part, including the requirements of appendices A, C, D, E, and G to this part no later than December 27, 2011.
(b) Not withstanding specific dates included in this part, beginning January 1, 2008, when existing networks are not in conformance with the minimum number of required monitors specified in this part, additional required monitors must be identified in the next applicable annual monitoring network plan, with monitoring operation beginning by January 1 of the following year. To allow sufficient time to prepare and comment on Annual Monitoring Network Plans, only monitoring requirements effective 120 days prior to the required submission date of the plan (i.e., 120 days prior to July 1 of each year) shall be included in that year's annual monitoring network plan.
(c) The NO2 monitors required under Appendix D, section 4.3 of this part must be physically established and operating under all of the requirements of this part, including the requirements of appendices A, C, D, and E to this part, no later than:
(1) January 1, 2013, for area-wide NO2 monitors required in Appendix D, section 4.3.3;
(2) January 1, 2013, for NO2 monitors intended to characterize vulnerable and susceptible populations that are required in Appendix D, section 4.3.4;
(3) January 1, 2014, for an initial near-road NO2 monitor in CBSAs having 1,000,000 million or more persons that is required in Appendix D, section 4.3.2;
(4) January 1, 2015, for a second near-road NO2 monitor in CBSAs that have a population of 2,500,000 or more persons or a second monitor in any CBSA with a population of 1,000,000 or more persons that has one or more roadway segments with 250,000 or greater AADT counts that is required in appendix D, section 4.3.2.
(d) The network of SO2 monitors must be physically established no later than January 1, 2013, and at that time, must be operating under all of the requirements of this part, including the requirements of appendices A, C, D, and E to this part.
(e) The CO monitors required under Appendix D, section 4.2 of this part must be physically established and operating under all of the requirements of this part, including the requirements of appendices A, C, D, and E to this part, no later than:
(1) January 1, 2015 for CO monitors in CBSAs having 2.5 million persons or more; or
(2) January 1, 2017 for other CO monitors.
(f) PM2.5 monitors required in near-road environments as described in appendix D to this part, must be physically established and operating under all of the requirements of this part, including the requirements of appendices A, C, D, and E to this part, no later than:
(1) January 1, 2015 for PM2.5 monitors in CBSAs having 2.5 million persons or more; or
(2) January 1, 2017 for PM2.5 monitors in CBSAs having 1 million or more, but less than 2.5 million persons.
(g) The O3 monitors required under appendix D, section 4.1 of this part must operate on the first day of the applicable required O3 monitoring season in effect January 1, 2017.
(h) The Photochemical Assessment Monitoring sites required under appendix D of this part, section 5(a), must be physically established and operating under all of the requirements of this part, including the requirements of appendix A, C, D, and E of this part, no later than June 1, 2021.
[71 FR 61298, Oct. 17, 2006, as amended at 73 FR 67059, Nov. 12, 2008; 75 FR 6534, Feb. 9, 2010; 75 FR 35601, June 22, 2010; 75 FR 81137, Dec. 27, 2010; 76 FR 54341, Aug. 31, 2011; 78 FR 16188, Mar. 14, 2013; 78 FR 3283, Jan. 15, 2013; 80 FR 65466, Oct. 26, 2015; 81 FR 96388, Dec. 30, 2016; 85 FR 837, Jan. 8, 2020]
§ 58.14 System modification.
(a) The state, or where appropriate local, agency shall develop a network modification plan and schedule to modify the ambient air quality monitoring network that addresses the findings of the network assessment required every 5 years by § 58.10(d). The network modification plan shall be submitted as part of the Annual Monitoring Network Plan that is due no later than the year after submittal of the network assessment.
(b) Nothing in this section shall preclude the State, or where appropriate local, agency from making modifications to the SLAMS network for reasons other than those resulting from the periodic network assessments. These modifications must be reviewed and approved by the Regional Administrator. Each monitoring network may make or be required to make changes between the 5-year assessment periods, including for example, site relocations or the addition of PAMS networks in bumped-up ozone nonattainment areas. These modifications must address changes invoked by a new census and changes due to changing air quality levels. The State, or where appropriate local, agency shall provide written communication describing the network changes to the Regional Administrator for review and approval as these changes are identified.
(c) State, or where appropriate, local agency requests for SLAMS monitor station discontinuation, subject to the review of the Regional Administrator, will be approved if any of the following criteria are met and if the requirements of appendix D to this part, if any, continue to be met. Other requests for discontinuation may also be approved on a case-by-case basis if discontinuance does not compromise data collection needed for implementation of a NAAQS and if the requirements of appendix D to this part, if any, continue to be met.
(1) Any PM2.5, O3, CO, PM10, SO2, Pb, or NO2 SLAMS monitor which has shown attainment during the previous five years, that has a probability of less than 10 percent of exceeding 80 percent of the applicable NAAQS during the next three years based on the levels, trends, and variability observed in the past, and which is not specifically required by an attainment plan or maintenance plan. In a nonattainment or maintenance area, if the most recent attainment or maintenance plan adopted by the State and approved by EPA contains a contingency measure to be triggered by an air quality concentration and the monitor to be discontinued is the only SLAMS monitor operating in the nonattainment or maintenance area, the monitor may not be discontinued.
(2) Any SLAMS monitor for CO, PM10, SO2, or NO2 which has consistently measured lower concentrations than another monitor for the same pollutant in the same county (or portion of a county within a distinct attainment area, nonattainment area, or maintenance area, as applicable) during the previous five years, and which is not specifically required by an attainment plan or maintenance plan, if control measures scheduled to be implemented or discontinued during the next five years would apply to the areas around both monitors and have similar effects on measured concentrations, such that the retained monitor would remain the higher reading of the two monitors being compared.
(3) For any pollutant, any SLAMS monitor in a county (or portion of a county within a distinct attainment, nonattainment, or maintenance area, as applicable) provided the monitor has not measured violations of the applicable NAAQS in the previous five years, and the approved SIP provides for a specific, reproducible approach to representing the air quality of the affected county in the absence of actual monitoring data.
(4) A PM2.5 SLAMS monitor which EPA has determined cannot be compared to the relevant NAAQS because of the siting of the monitor, in accordance with § 58.30.
(5) A SLAMS monitor that is designed to measure concentrations upwind of an urban area for purposes of characterizing transport into the area and that has not recorded violations of the relevant NAAQS in the previous five years, if discontinuation of the monitor is tied to start-up of another station also characterizing transport.
(6) A SLAMS monitor not eligible for removal under any of the criteria in paragraphs (c)(1) through (c)(5) of this section may be moved to a nearby location with the same scale of representation if logistical problems beyond the State's control make it impossible to continue operation at its current site.
[71 FR 61298, Oct. 17, 2006, as amended at 81 FR 17280, Mar. 28, 2016]
§ 58.15 Annual air monitoring data certification.
(a) The state, or where appropriate local, agency shall submit to the EPA Regional Administrator an annual air monitoring data certification letter to certify data collected by FRM, FEM, and ARM monitors at SLAMS and SPM sites that meet criteria in appendix A to this part from January 1 to December 31 of the previous year. The head official in each monitoring agency, or his or her designee, shall certify that the previous year of ambient concentration and quality assurance data are completely submitted to AQS and that the ambient concentration data are accurate to the best of her or his knowledge, taking into consideration the quality assurance findings. The annual data certification letter is due by May 1 of each year.
(b) Along with each certification letter, the state shall submit to the Regional Administrator an annual summary report of all the ambient air quality data collected by FRM, FEM, and ARM monitors at SLAMS and SPM sites. The annual report(s) shall be submitted for data collected from January 1 to December 31 of the previous year. The annual summary serves as the record of the specific data that is the object of the certification letter.
(c) Along with each certification letter, the state shall submit to the Regional Administrator a summary of the precision and accuracy data for all ambient air quality data collected by FRM, FEM, and ARM monitors at SLAMS and SPM sites. The summary of precision and accuracy shall be submitted for data collected from January 1 to December 31 of the previous year.
[81 FR 17280, Mar. 28, 2016]
§ 58.16 Data submittal and archiving requirements.
(a) The state, or where appropriate, local agency, shall report to the Administrator, via AQS all ambient air quality data and associated quality assurance data for SO2; CO; O3; NO2; NO; NOy; NOX; Pb-TSP mass concentration; Pb-PM10 mass concentration; PM10 mass concentration; PM2.5 mass concentration; for filter-based PM2.5 FRM/FEM, the field blank mass; chemically speciated PM2.5 mass concentration data; PM10-2.5 mass concentration; meteorological data from NCore and PAMS sites; and metadata records and information specified by the AQS Data Coding Manual (https://www.epa.gov/sites/production/files/2015-09/documents/aqs_data_coding_manual_0.pdf). Air quality data and information must be submitted directly to the AQS via electronic transmission on the specified schedule described in paragraphs (b) and (d) of this section.
(b) The specific quarterly reporting periods are January 1-March 31, April 1-June 30, July 1-September 30, and October 1-December 31. The data and information reported for each reporting period must contain all data and information gathered during the reporting period, and be received in the AQS within 90 days after the end of the quarterly reporting period. For example, the data for the reporting period January 1-March 31 are due on or before June 30 of that year.
(c) Air quality data submitted for each reporting period must be edited, validated, and entered into the AQS (within the time limits specified in paragraphs (b) and (d) of this section) pursuant to appropriate AQS procedures. The procedures for editing and validating data are described in the AQS Data Coding Manual and in each monitoring agency's quality assurance project plan.
(d) The state shall report VOC and if collected, carbonyl, NH3, and HNO3 data from PAMS sites, and chemically speciated PM2.5 mass concentration data to AQS within 6 months following the end of each quarterly reporting period listed in paragraph (b) of this section.
(e) The State shall also submit any portion or all of the SLAMS and SPM data to the appropriate Regional Administrator upon request.
(f) The state, or where applicable, local agency shall archive all PM2.5, PM10, and PM10-2.5 filters from manual low-volume samplers (samplers having flow rates less than 200 liters/minute) from all SLAMS sites for a minimum period of 5 years after collection. These filters shall be made available for supplemental analyses, including destructive analyses if necessary, at the request of EPA or to provide information to state and local agencies on particulate matter composition. Other Federal agencies may request access to filters for purposes of supporting air quality management or community health—such as biological assay—through the applicable EPA Regional Administrator. The filters shall be archived according to procedures approved by the Administrator, which shall include cold storage of filters after post-sampling laboratory analyses for at least 12 months following field sampling. The EPA recommends that particulate matter filters be archived for longer periods, especially for key sites in making NAAQS-related decisions or for supporting health-related air pollution studies.
(g) Any State or, where applicable, local agency operating a continuous SO2 analyzer shall report the maximum 5-minute SO2 block average of the twelve 5-minute block averages in each hour, in addition to the hourly SO2 average.
[71 FR 61298, Oct. 17, 2006, as amended at 73 FR 67059, Nov. 12, 2008; 75 FR 6534, Feb. 9, 2010; 75 FR 35602, June 22, 2010; 78 FR 3283, Jan. 15, 2013; 81 FR 17280, Mar. 28, 2016]
Subpart C - Special Purpose Monitors
Source:
71 FR 61302, Oct. 17, 2006, unless otherwise noted.
§ 58.20 Special purpose monitors (SPM).
(a) An SPM is defined as any monitor included in an agency's monitoring network that the agency has designated as a special purpose monitor in its annual monitoring network plan and in AQS, and which the agency does not count when showing compliance with the minimum requirements of this subpart for the number and siting of monitors of various types. Any SPM operated by an air monitoring agency must be included in the periodic assessments and annual monitoring network plan required by § 58.10. The plan shall include a statement of purposes for each SPM monitor and evidence that operation of each monitor meets the requirements of appendix A or an approved alternative as provided by § 58.11(a)(2) where applicable. The monitoring agency may designate a monitor as an SPM after January 1, 2007 only if it is a new monitor, i.e., a SLAMS monitor that is not included in the currently applicable monitoring plan or, for a monitor included in the monitoring plan prior to January 1, 2007, if the Regional Administrator has approved the discontinuation of the monitor as a SLAMS site.
(b) Any SPM data collected by an air monitoring agency using a Federal reference method (FRM), Federal equivalent method (FEM), or approved regional method (ARM) must meet the requirements of § 58.11, § 58.12, and appendix A to this part or an approved alternative to appendix A to this part. Compliance with appendix E to this part is optional but encouraged except when the monitoring agency's data objectives are inconsistent with those requirements. Data collected at an SPM using a FRM, FEM, or ARM meeting the requirements of appendix A must be submitted to AQS according to the requirements of § 58.16. Data collected by other SPMs may be submitted. The monitoring agency must also submit to AQS an indication of whether each SPM reporting data to AQS monitor meets the requirements of appendices A and E to this part.
(c) All data from an SPM using an FRM, FEM, or ARM which has operated for more than 24 months are eligible for comparison to the relevant NAAQS, subject to the conditions of §§ 58.11(e) and 58.30, unless the air monitoring agency demonstrates that the data came from a particular period during which the requirements of appendix A, appendix C, or appendix E to this part were not met, subject to review and EPA Regional Office approval as part of t, App. he annual monitoring network plan described in § 58.10.
(d) If an SPM using an FRM, FEM, or ARM is discontinued within 24 months of start-up, the Administrator will not base a NAAQS violation determination for the PM2.5 or ozone NAAQS solely on data from the SPM.
(e) If an SPM using an FRM, FEM, or ARM is discontinued within 24 months of start-up, the Administrator will not designate an area as nonattainment for the CO, SO2, NO2, or 24-hour PM10 NAAQS solely on the basis of data from the SPM. Such data are eligible for use in determinations of whether a nonattainment area has attained one of these NAAQS.
(f) Prior approval from EPA is not required for discontinuance of an SPM.
[71 FR 61298, Oct. 17, 2006, as amended at 72 FR 32210, June 12, 2007; 73 FR 67060, Nov. 12, 2008; 78 FR 3283, Jan. 15, 2013]
Subpart D - Comparability of Ambient Data to the NAAQS
Source:
71 FR 61302, Oct. 17, 2006, unless otherwise noted.
§ 58.30 Special considerations for data comparisons to the NAAQS.
(a) Comparability of PM2.5 data. The primary and secondary annual and 24-hour PM2.5 NAAQS are described in part 50 of this chapter. Monitors that follow the network technical requirements specified in § 58.11 are eligible for comparison to the NAAQS subject to the additional requirements of this section. PM2.5 measurement data from all eligible monitors are comparable to the 24-hour PM2.5 NAAQS. PM2.5 measurement data from all eligible monitors that are representative of area-wide air quality are comparable to the annual PM2.5 NAAQS. Consistent with appendix D to this part, section 4.7.1, when micro- or middle-scale PM2.5 monitoring sites collectively identify a larger region of localized high ambient PM2.5 concentrations, such sites would be considered representative of an area-wide location and, therefore, eligible for comparison to the annual PM2.5 NAAQS. PM2.5 measurement data from monitors that are not representative of area-wide air quality but rather of relatively unique micro-scale, or localized hot spot, or unique middle-scale impact sites are not eligible for comparison to the annual PM2.5 NAAQS. PM2.5 measurement data from these monitors are eligible for comparison to the 24-hour PM2.5 NAAQS. For example, if a micro- or middle-scale PM2.5 monitoring site is adjacent to a unique dominating local PM2.5 source, then the PM2.5 measurement data from such a site would only be eligible for comparison to the 24-hour PM2.5 NAAQS. Approval of sites that are suitable and sites that are not suitable for comparison with the annual PM2.5 NAAQS is provided for as part of the annual monitoring network plan described in § 58.10.
(b) [Reserved]
[71 FR 61302, Oct. 17, 2006, as amended at 78 FR 3283, Jan. 15, 2013]
Subpart E [Reserved]
Subpart F - Air Quality Index Reporting
§ 58.50 Index reporting.
(a) The State or where applicable, local agency shall report to the general public on a daily basis through prominent notice an air quality index that complies with the requirements of appendix G to this part.
(b) Reporting is required for all individual MSA with a population exceeding 350,000.
(c) The population of a metropolitan statistical area for purposes of index reporting is the latest available U.S. census population.
[71 FR 61302, Oct. 17, 2006, as amended at 80 FR 65466, Oct. 26, 2015]
Subpart G - Federal Monitoring
Source:
44 FR 27571, May 10, 1979, unless otherwise noted. Redesignated at 58 FR 8467, Feb. 12, 1993.
§ 58.60 Federal monitoring.
The Administrator may locate and operate an ambient air monitoring site if the State or local agency fails to locate, or schedule to be located, during the initial network design process, or as a result of the 5-year network assessments required in § 58.10, a SLAMS station at a site which is necessary in the judgment of the Regional Administrator to meet the objectives defined in appendix D to this part.
[71 FR 61303, Oct. 17, 2006]
§ 58.61 Monitoring other pollutants.
The Administrator may promulgate criteria similar to that referenced in subpart B of this part for monitoring a pollutant for which an NAAQS does not exist. Such an action would be taken whenever the Administrator determines that a nationwide monitoring program is necessary to monitor such a pollutant.
[71 FR 61303, Oct. 17, 2006]
Appendix A to Part 58—Quality Assurance Requirements for Monitors used in Evaluations of National Ambient Air Quality Standards
1. General Information
2. Quality System Requirements
3. Measurement Quality Check Requirements
4. Calculations for Data Quality Assessments
5. Reporting Requirements
6. References
1. General Information
1.1 Applicability.
(a) This appendix specifies the minimum quality system requirements applicable to SLAMS and other monitor types whose data are intended to be used to determine compliance with the NAAQS (e.g., SPMs, tribal, CASTNET, NCore, industrial, etc.), unless the EPA Regional Administrator has reviewed and approved the monitor for exclusion from NAAQS use and these quality assurance requirements.
(b) Primary quality assurance organizations are encouraged to develop and maintain quality systems more extensive than the required minimums. Additional guidance for the requirements reflected in this appendix can be found in the “Quality Assurance Handbook for Air Pollution Measurement Systems,” Volume II (see reference 10 of this appendix) and at a national level in references 1, 2, and 3 of this appendix.
1.2 Primary Quality Assurance Organization (PQAO). A PQAO is defined as a monitoring organization or a group of monitoring organizations or other organization that is responsible for a set of stations that monitors the same pollutant and for which data quality assessments will be pooled. Each criteria pollutant sampler/monitor must be associated with only one PQAO. In some cases, data quality is assessed at the PQAO level.
1.2.1 Each PQAO shall be defined such that measurement uncertainty among all stations in the organization can be expected to be reasonably homogeneous as a result of common factors. Common factors that should be considered in defining PQAOs include:
(a) Operation by a common team of field operators according to a common set of procedures;
(b) Use of a common quality assurance project plan (QAPP) or standard operating procedures;
(c) Common calibration facilities and standards;
(d) Oversight by a common quality assurance organization; and
(e) Support by a common management organization (i.e., state agency) or laboratory.
Since data quality assessments are made and data certified at the PQAO level, the monitoring organization identified as the PQAO will be responsible for the oversight of the quality of data of all monitoring organizations within the PQAO.
1.2.2 Monitoring organizations having difficulty describing its PQAO or in assigning specific monitors to primary quality assurance organizations should consult with the appropriate EPA Regional Office. Any consolidation of monitoring organizations to PQAOs shall be subject to final approval by the appropriate EPA Regional Office.
1.2.3 Each PQAO is required to implement a quality system that provides sufficient information to assess the quality of the monitoring data. The quality system must, at a minimum, include the specific requirements described in this appendix. Failure to conduct or pass a required check or procedure, or a series of required checks or procedures, does not by itself invalidate data for regulatory decision making. Rather, PQAOs and the EPA shall use the checks and procedures required in this appendix in combination with other data quality information, reports, and similar documentation that demonstrate overall compliance with Part 58. Accordingly, the EPA and PQAOs shall use a “weight of evidence” approach when determining the suitability of data for regulatory decisions. The EPA reserves the authority to use or not use monitoring data submitted by a monitoring organization when making regulatory decisions based on the EPA's assessment of the quality of the data. Consensus built validation templates or validation criteria already approved in QAPPs should be used as the basis for the weight of evidence approach.
1.3 Definitions.
(a) Measurement Uncertainty. A term used to describe deviations from a true concentration or estimate that are related to the measurement process and not to spatial or temporal population attributes of the air being measured.
(b) Precision. A measurement of mutual agreement among individual measurements of the same property usually under prescribed similar conditions, expressed generally in terms of the standard deviation.
(c) Bias. The systematic or persistent distortion of a measurement process which causes errors in one direction.
(d) Accuracy. The degree of agreement between an observed value and an accepted reference value. Accuracy includes a combination of random error (imprecision) and systematic error (bias) components which are due to sampling and analytical operations.
(e) Completeness. A measure of the amount of valid data obtained from a measurement system compared to the amount that was expected to be obtained under correct, normal conditions.
(f) Detection Limit. The lowest concentration or amount of target analyte that can be determined to be different from zero by a single measurement at a stated level of probability.
1.4 Measurement Quality Checks. The measurement quality checks described in section 3 of this appendix shall be reported to AQS and are included in the data required for certification.
1.5 Assessments and Reports. Periodic assessments and documentation of data quality are required to be reported to the EPA. To provide national uniformity in this assessment and reporting of data quality for all networks, specific assessment and reporting procedures are prescribed in detail in sections 3, 4, and 5 of this appendix. On the other hand, the selection and extent of the quality assurance and quality control activities used by a monitoring organization depend on a number of local factors such as field and laboratory conditions, the objectives for monitoring, the level of data quality needed, the expertise of assigned personnel, the cost of control procedures, pollutant concentration levels, etc. Therefore, quality system requirements in section 2 of this appendix are specified in general terms to allow each monitoring organization to develop a quality system that is most efficient and effective for its own circumstances while achieving the data quality objectives described in this appendix.
2. Quality System Requirements
A quality system (reference 1 of this appendix) is the means by which an organization manages the quality of the monitoring information it produces in a systematic, organized manner. It provides a framework for planning, implementing, assessing and reporting work performed by an organization and for carrying out required quality assurance and quality control activities.
2.1 Quality Management Plans and Quality Assurance Project Plans. All PQAOs must develop a quality system that is described and approved in quality management plans (QMP) and QAPPs to ensure that the monitoring results:
(a) Meet a well-defined need, use, or purpose (reference 5 of this appendix);
(b) Provide data of adequate quality for the intended monitoring objectives;
(c) Satisfy stakeholder expectations;
(d) Comply with applicable standards specifications;
(e) Comply with statutory (and other legal) requirements; and
(f) Reflect consideration of cost and economics.
2.1.1 The QMP describes the quality system in terms of the organizational structure, functional responsibilities of management and staff, lines of authority, and required interfaces for those planning, implementing, assessing and reporting activities involving environmental data operations (EDO). The QMP must be suitably documented in accordance with EPA requirements (reference 2 of this appendix), and approved by the appropriate Regional Administrator, or his or her representative. The quality system described in the QMP will be reviewed during the systems audits described in section 2.5 of this appendix. Organizations that implement long-term monitoring programs with EPA funds should have a separate QMP document. Smaller organizations, organizations that do infrequent work with the EPA or have monitoring programs of limited size or scope may combine the QMP with the QAPP if approved by, and subject to any conditions of the EPA. Additional guidance on this process can be found in reference 10 of this appendix. Approval of the recipient's QMP by the appropriate Regional Administrator or his or her representative may allow delegation of authority to the PQAOs independent quality assurance function to review and approve environmental data collection activities adequately described and covered under the scope of the QMP and documented in appropriate planning documents (QAPP). Where a PQAO or monitoring organization has been delegated authority to review and approve their QAPP, an electronic copy must be submitted to the EPA region at the time it is submitted to the PQAO/monitoring organization's QAPP approving authority. The QAPP will be reviewed by the EPA during systems audits or circumstances related to data quality. The QMP submission and approval dates for PQAOs/monitoring organizations must be reported to AQS either by the monitoring organization or the EPA Region.
2.1.2 The QAPP is a formal document describing, in sufficient detail, the quality system that must be implemented to ensure that the results of work performed will satisfy the stated objectives. PQAOs must develop QAPPs that describe how the organization intends to control measurement uncertainty to an appropriate level in order to achieve the data quality objectives for the EDO. The quality assurance policy of the EPA requires every EDO to have a written and approved QAPP prior to the start of the EDO. It is the responsibility of the PQAO/monitoring organization to adhere to this policy. The QAPP must be suitably documented in accordance with EPA requirements (reference 3 of this appendix) and include standard operating procedures for all EDOs either within the document or by appropriate reference. The QAPP must identify each PQAO operating monitors under the QAPP as well as generally identify the sites and monitors to which it is applicable either within the document or by appropriate reference. The QAPP submission and approval dates must be reported to AQS either by the monitoring organization or the EPA Region.
2.1.3 The PQAO/monitoring organization's quality system must have adequate resources both in personnel and funding to plan, implement, assess and report on the achievement of the requirements of this appendix and it's approved QAPP.
2.2 Independence of Quality Assurance. The PQAO must provide for a quality assurance management function, that aspect of the overall management system of the organization that determines and implements the quality policy defined in a PQAO's QMP. Quality management includes strategic planning, allocation of resources and other systematic planning activities (e.g., planning, implementation, assessing and reporting) pertaining to the quality system. The quality assurance management function must have sufficient technical expertise and management authority to conduct independent oversight and assure the implementation of the organization's quality system relative to the ambient air quality monitoring program and should be organizationally independent of environmental data generation activities.
2.3. Data Quality Performance Requirements.
2.3.1 Data Quality Objectives. The DQOs, or the results of other systematic planning processes, are statements that define the appropriate type of data to collect and specify the tolerable levels of potential decision errors that will be used as a basis for establishing the quality and quantity of data needed to support the monitoring objectives (reference 5 of this appendix). The DQOs will be developed by the EPA to support the primary regulatory objectives for each criteria pollutant. As they are developed, they will be added to the regulation. The quality of the conclusions derived from data interpretation can be affected by population uncertainty (spatial or temporal uncertainty) and measurement uncertainty (uncertainty associated with collecting, analyzing, reducing and reporting concentration data). This appendix focuses on assessing and controlling measurement uncertainty.
2.3.1.1 Measurement Uncertainty for Automated and Manual PM2.5 Methods. The goal for acceptable measurement uncertainty is defined for precision as an upper 90 percent confidence limit for the coefficient of variation (CV) of 10 percent and ±10 percent for total bias.
2.3.1.2 Measurement Uncertainty for Automated O3 Methods. The goal for acceptable measurement uncertainty is defined for precision as an upper 90 percent confidence limit for the CV of 7 percent and for bias as an upper 95 percent confidence limit for the absolute bias of 7 percent.
2.3.1.3 Measurement Uncertainty for Pb Methods. The goal for acceptable measurement uncertainty is defined for precision as an upper 90 percent confidence limit for the CV of 20 percent and for bias as an upper 95 percent confidence limit for the absolute bias of 15 percent.
2.3.1.4 Measurement Uncertainty for NO2. The goal for acceptable measurement uncertainty is defined for precision as an upper 90 percent confidence limit for the CV of 15 percent and for bias as an upper 95 percent confidence limit for the absolute bias of 15 percent.
2.3.1.5 Measurement Uncertainty for SO 2. The goal for acceptable measurement uncertainty for precision is defined as an upper 90 percent confidence limit for the CV of 10 percent and for bias as an upper 95 percent confidence limit for the absolute bias of 10 percent.
2.4 National Performance Evaluation Programs. The PQAO shall provide for the implementation of a program of independent and adequate audits of all monitors providing data for NAAQS compliance purposes including the provision of adequate resources for such audit programs. A monitoring plan (or QAPP) which provides for PQAO participation in the EPA's National Performance Audit Program (NPAP), the PM2.5 Performance Evaluation Program (PM2.5-PEP) program and the Pb Performance Evaluation Program (Pb-PEP) and indicates the consent of the PQAO for the EPA to apply an appropriate portion of the grant funds, which the EPA would otherwise award to the PQAO for these QA activities, will be deemed by the EPA to meet this requirement. For clarification and to participate, PQAOs should contact either the appropriate EPA regional quality assurance (QA) coordinator at the appropriate EPA Regional Office location, or the NPAP coordinator at the EPA Air Quality Assessment Division, Office of Air Quality Planning and Standards, in Research Triangle Park, North Carolina. The PQAOs that plan to implement these programs (self-implement) rather than use the federal programs must meet the adequacy requirements found in the appropriate sections that follow, as well as meet the definition of independent assessment that follows.
2.4.1 Independent assessment. An assessment performed by a qualified individual, group, or organization that is not part of the organization directly performing and accountable for the work being assessed. This auditing organization must not be involved with the generation of the ambient air monitoring data. An organization can conduct the performance evaluation (PE) if it can meet this definition and has a management structure that, at a minimum, will allow for the separation of its routine sampling personnel from its auditing personnel by two levels of management. In addition, the sample analysis of audit filters must be performed by a laboratory facility and laboratory equipment separate from the facilities used for routine sample analysis. Field and laboratory personnel will be required to meet PE field and laboratory training and certification requirements to establish comparability to federally implemented programs.
2.5 Technical Systems Audit Program. Technical systems audits of each PQAO shall be conducted at least every 3 years by the appropriate EPA Regional Office and reported to the AQS. If a PQAO is made up of more than one monitoring organization, all monitoring organizations in the PQAO should be audited within 6 years (two TSA cycles of the PQAO). As an example, if a state has five local monitoring organizations that are consolidated under one PQAO, all five local monitoring organizations should receive a technical systems audit within a 6-year period. Systems audit programs are described in reference 10 of this appendix.
2.6 Gaseous and Flow Rate Audit Standards.
2.6.1 Gaseous pollutant concentration standards (permeation devices or cylinders of compressed gas) used to obtain test concentrations for CO, SO2, NO, and NO2 must be traceable to either a National Institute of Standards and Technology (NIST) Traceable Reference Material (NTRM) or a NIST-certified Gas Manufacturer's Internal Standard (GMIS), certified in accordance with one of the procedures given in reference 4 of this appendix. Vendors advertising certification with the procedures provided in reference 4 of this appendix and distributing gases as “EPA Protocol Gas” for ambient air monitoring purposes must participate in the EPA Ambient Air Protocol Gas Verification Program or not use “EPA” in any form of advertising. Monitoring organizations must provide information to the EPA on the gas producers they use on an annual basis and those PQAOs purchasing standards will be obligated, at the request of the EPA, to participate in the program at least once every 5 years by sending a new unused standard to a designated verification laboratory.
2.6.2 Test concentrations for O3 must be obtained in accordance with the ultraviolet photometric calibration procedure specified in appendix D to Part 50 of this chapter and by means of a certified NIST-traceable O3 transfer standard. Consult references 7 and 8 of this appendix for guidance on transfer standards for O3.
2.6.3 Flow rate measurements must be made by a flow measuring instrument that is NIST-traceable to an authoritative volume or other applicable standard. Guidance for certifying some types of flowmeters is provided in reference 10 of this appendix.
2.7 Primary Requirements and Guidance. Requirements and guidance documents for developing the quality system are contained in references 1 through 11 of this appendix, which also contain many suggested procedures, checks, and control specifications. Reference 10 describes specific guidance for the development of a quality system for data collected for comparison to the NAAQS. Many specific quality control checks and specifications for methods are included in the respective reference methods described in Part 50 of this chapter or in the respective equivalent method descriptions available from the EPA (reference 6 of this appendix). Similarly, quality control procedures related to specifically designated reference and equivalent method monitors are contained in the respective operation or instruction manuals associated with those monitors.
3. Measurement Quality Check Requirements
This section provides the requirements for PQAOs to perform the measurement quality checks that can be used to assess data quality. Data from these checks are required to be submitted to the AQS within the same time frame as routinely-collected ambient concentration data as described in 40 CFR 58.16. Table A-1 of this appendix provides a summary of the types and frequency of the measurement quality checks that will be described in this section.
3.1. Gaseous Monitors of SO2, NO2, O3, and CO.
3.1.1 One-Point Quality Control (QC) Check for SO2, NO2, O3, and CO.
(a) A one-point QC check must be performed at least once every 2 weeks on each automated monitor used to measure SO2, NO2, O3 and CO. With the advent of automated calibration systems, more frequent checking is strongly encouraged. See Reference 10 of this appendix for guidance on the review procedure. The QC check is made by challenging the monitor with a QC check gas of known concentration (effective concentration for open path monitors) between the prescribed range of 0.005 and 0.08 parts per million (ppm) for SO2, NO2, and O3, and between the prescribed range of 0.5 and 5 ppm for CO monitors. The QC check gas concentration selected within the prescribed range should be related to the monitoring objectives for the monitor. If monitoring at an NCore site or for trace level monitoring, the QC check concentration should be selected to represent the mean or median concentrations at the site. If the mean or median concentrations at trace gas sites are below the MDL of the instrument the agency can select the lowest concentration in the prescribed range that can be practically achieved. If the mean or median concentrations at trace gas sites are above the prescribed range the agency can select the highest concentration in the prescribed range. An additional QC check point is encouraged for those organizations that may have occasional high values or would like to confirm the monitors' linearity at the higher end of the operational range or around NAAQS concentrations. If monitoring for NAAQS decisions, the QC concentration can be selected at a higher concentration within the prescribed range but should also consider precision points around mean or median monitor concentrations.
(b) Point analyzers must operate in their normal sampling mode during the QC check and the test atmosphere must pass through all filters, scrubbers, conditioners and other components used during normal ambient sampling and as much of the ambient air inlet system as is practicable. The QC check must be conducted before any calibration or adjustment to the monitor.
(c) Open path monitors are tested by inserting a test cell containing a QC check gas concentration into the optical measurement beam of the instrument. If possible, the normally used transmitter, receiver, and as appropriate, reflecting devices should be used during the test, and the normal monitoring configuration of the instrument should be altered as little as possible to accommodate the test cell for the test. However, if permitted by the associated operation or instruction manual, an alternate local light source or an alternate optical path that does not include the normal atmospheric monitoring path may be used. The actual concentration of the QC check gas in the test cell must be selected to produce an effective concentration in the range specified earlier in this section. Generally, the QC test concentration measurement will be the sum of the atmospheric pollutant concentration and the QC test concentration. As such, the result must be corrected to remove the atmospheric concentration contribution. The corrected concentration is obtained by subtracting the average of the atmospheric concentrations measured by the open path instrument under test immediately before and immediately after the QC test from the QC check gas concentration measurement. If the difference between these before and after measurements is greater than 20 percent of the effective concentration of the test gas, discard the test result and repeat the test. If possible, open path monitors should be tested during periods when the atmospheric pollutant concentrations are relatively low and steady.
(d) Report the audit concentration of the QC gas and the corresponding measured concentration indicated by the monitor to AQS. The percent differences between these concentrations are used to assess the precision and bias of the monitoring data as described in sections 4.1.2 (precision) and 4.1.3 (bias) of this appendix.
3.1.2 Annual performance evaluation for SO2 , NO2, O3, or CO. A performance evaluation must be conducted on each primary monitor once a year. This can be accomplished by evaluating 25 percent of the primary monitors each quarter. The evaluation should be conducted by a trained experienced technician other than the routine site operator.
3.1.2.1 The evaluation is made by challenging the monitor with audit gas standards of known concentration from at least three audit levels. One point must be within two to three times the method detection limit of the instruments within the PQAOs network, the second point will be less than or equal to the 99th percentile of the data at the site or the network of sites in the PQAO or the next highest audit concentration level. The third point can be around the primary NAAQS or the highest 3-year concentration at the site or the network of sites in the PQAO. An additional 4th level is encouraged for those agencies that would like to confirm the monitors' linearity at the higher end of the operational range. In rare circumstances, there may be sites measuring concentrations above audit level 10. Notify the appropriate EPA region and the AQS program in order to make accommodations for auditing at levels above level 10.
| Audit level | Concentration Range, ppm | |||
|---|---|---|---|---|
| O3 | SO2 | NO2 | CO | |
| 1 | 0.004-0.0059 | 0.0003-0.0029 | 0.0003-0.0029 | 0.020-0.059 |
| 2 | 0.006-0.019 | 0.0030-0.0049 | 0.0030-0.0049 | 0.060-0.199 |
| 3 | 0.020-0.039 | 0.0050-0.0079 | 0.0050-0.0079 | 0.200-0.899 |
| 4 | 0.040-0.069 | 0.0080-0.0199 | 0.0080-0.0199 | 0.900-2.999 |
| 5 | 0.070-0.089 | 0.0200-0.0499 | 0.0200-0.0499 | 3.000-7.999 |
| 6 | 0.090-0.119 | 0.0500-0.0999 | 0.0500-0.0999 | 8.000-15.999 |
| 7 | 0.120-0.139 | 0.1000-0.1499 | 0.1000-0.2999 | 16.000-30.999 |
| 8 | 0.140-0.169 | 0.1500-0.2599 | 0.3000-0.4999 | 31.000-39.999 |
| 9 | 0.170-0.189 | 0.2600-0.7999 | 0.5000-0.7999 | 40.000-49.999 |
| 10 | 0.190-0.259 | 0.8000-1.000 | 0.8000-1.000 | 50.000-60.000 |
3.1.2.2 The NO2 audit techniques may vary depending on the ambient monitoring method. For chemiluminescence-type NO2 analyzers, gas phase titration (GPT) techniques should be based on EPA guidance documents and monitoring agency experience. The NO2 gas standards may be more appropriate than GPT for direct NO2 methods that do not employ converters. Care should be taken to ensure the stability of such gas standards prior to use.
3.1.2.3 The standards from which audit gas test concentrations are obtained must meet the specifications of section 2.6.1 of this appendix. The gas standards and equipment used for the performance evaluation must not be the same as the standards and equipment used for one-point QC, calibrations, span evaluations or NPAP.
3.1.2.4 For point analyzers, the evaluation shall be carried out by allowing the monitor to analyze the audit gas test atmosphere in its normal sampling mode such that the test atmosphere passes through all filters, scrubbers, conditioners, and other sample inlet components used during normal ambient sampling and as much of the ambient air inlet system as is practicable.
3.1.2.5 Open-path monitors are evaluated by inserting a test cell containing the various audit gas concentrations into the optical measurement beam of the instrument. If possible, the normally used transmitter, receiver, and, as appropriate, reflecting devices should be used during the evaluation, and the normal monitoring configuration of the instrument should be modified as little as possible to accommodate the test cell for the evaluation. However, if permitted by the associated operation or instruction manual, an alternate local light source or an alternate optical path that does not include the normal atmospheric monitoring path may be used. The actual concentrations of the audit gas in the test cell must be selected to produce effective concentrations in the evaluation level ranges specified in this section of this appendix. Generally, each evaluation concentration measurement result will be the sum of the atmospheric pollutant concentration and the evaluation test concentration. As such, the result must be corrected to remove the atmospheric concentration contribution. The corrected concentration is obtained by subtracting the average of the atmospheric concentrations measured by the open path instrument under test immediately before and immediately after the evaluation test (or preferably before and after each evaluation concentration level) from the evaluation concentration measurement. If the difference between the before and after measurements is greater than 20 percent of the effective concentration of the test gas standard, discard the test result for that concentration level and repeat the test for that level. If possible, open path monitors should be evaluated during periods when the atmospheric pollutant concentrations are relatively low and steady. Also, if the open-path instrument is not installed in a permanent manner, the monitoring path length must be reverified to be within ±3 percent to validate the evaluation since the monitoring path length is critical to the determination of the effective concentration.
3.1.2.6 Report both the evaluation concentrations (effective concentrations for open-path monitors) of the audit gases and the corresponding measured concentration (corrected concentrations, if applicable, for open path monitors) indicated or produced by the monitor being tested to AQS. The percent differences between these concentrations are used to assess the quality of the monitoring data as described in section 4.1.1 of this appendix.
3.1.3 National Performance Audit Program (NPAP).
The NPAP is a performance evaluation which is a type of audit where quantitative data are collected independently in order to evaluate the proficiency of an analyst, monitoring instrument or laboratory. Due to the implementation approach used in the program, NPAP provides a national independent assessment of performance while maintaining a consistent level of data quality. Details of the program can be found in reference 11 of this appendix. The program requirements include:
3.1.3.1 Performing audits of the primary monitors at 20 percent of monitoring sites per year, and 100 percent of the sites every 6 years. High-priority sites may be audited more frequently. Since not all gaseous criteria pollutants are monitored at every site within a PQAO, it is not required that 20 percent of the primary monitors for each pollutant receive an NPAP audit each year only that 20 percent of the PQAOs monitoring sites receive an NPAP audit. It is expected that over the 6-year period all primary monitors for all gaseous pollutants will receive an NPAP audit.
3.1.3.2 Developing a delivery system that will allow for the audit concentration gasses to be introduced to the probe inlet where logistically feasible.
3.1.3.3 Using audit gases that are verified against the NIST standard reference methods or special review procedures and validated annually for CO, SO2 and NO2, and at the beginning of each quarter of audits for O3.
3.1.3.4 As described in section 2.4 of this appendix, the PQAO may elect, on an annual basis, to utilize the federally implemented NPAP program. If the PQAO plans to self-implement NPAP, the EPA will establish training and other technical requirements for PQAOs to establish comparability to federally implemented programs. In addition to meeting the requirements in sections 3.1.3.1 through 3.1.3.3 of this appendix, the PQAO must:
(a) Utilize an audit system equivalent to the federally implemented NPAP audit system and is separate from equipment used in annual performance evaluations.
(b) Perform a whole system check by having the NPAP system tested against an independent and qualified EPA lab, or equivalent.
(c) Evaluate the system with the EPA NPAP program through collocated auditing at an acceptable number of sites each year (at least one for an agency network of five or less sites; at least two for a network with more than five sites).
(d) Incorporate the NPAP in the PQAO's quality assurance project plan.
(e) Be subject to review by independent, EPA-trained personnel.
(f) Participate in initial and update training/certification sessions.
3.1.3.5 OAQPS, in consultation with the relevant EPA Regional Office, may approve the PQAO's plan to self-implement NPAP if the OAQPS determines that the PQAO's self-implementation plan is equivalent to the federal programs and adequate to meet the objectives of national consistency and data quality.
3.2 PM2.5.
3.2.1 Flow Rate Verification for PM2.5. A one-point flow rate verification check must be performed at least once every month (each verification minimally separated by 14 days) on each monitor used to measure PM2.5. The verification is made by checking the operational flow rate of the monitor. If the verification is made in conjunction with a flow rate adjustment, it must be made prior to such flow rate adjustment. For the standard procedure, use a flow rate transfer standard certified in accordance with section 2.6 of this appendix to check the monitor's normal flow rate. Care should be used in selecting and using the flow rate measurement device such that it does not alter the normal operating flow rate of the monitor. Report the flow rate of the transfer standard and the corresponding flow rate measured by the monitor to AQS. The percent differences between the audit and measured flow rates are used to assess the bias of the monitoring data as described in section 4.2.2 of this appendix (using flow rates in lieu of concentrations).
3.2.2 Semi-Annual Flow Rate Audit for PM2.5. Audit the flow rate of the particulate monitor twice a year. The two audits should ideally be spaced between 5 and 7 months apart. The EPA strongly encourages more frequent auditing. The audit should (preferably) be conducted by a trained experienced technician other than the routine site operator. The audit is made by measuring the monitor's normal operating flow rate(s) using a flow rate transfer standard certified in accordance with section 2.6 of this appendix. The flow rate standard used for auditing must not be the same flow rate standard used for verifications or to calibrate the monitor. However, both the calibration standard and the audit standard may be referenced to the same primary flow rate or volume standard. Care must be taken in auditing the flow rate to be certain that the flow measurement device does not alter the normal operating flow rate of the monitor. Report the audit flow rate of the transfer standard and the corresponding flow rate measured by the monitor to AQS. The percent differences between these flow rates are used to evaluate monitor performance.
3.2.3 Collocated Quality Control Sampling Procedures for PM2.5. For each pair of collocated monitors, designate one sampler as the primary monitor whose concentrations will be used to report air quality for the site, and designate the other as the quality control monitor. There can be only one primary monitor at a monitoring site for a given time period.
3.2.3.1 For each distinct monitoring method designation (FRM or FEM) that a PQAO is using for a primary monitor, the PQAO must have 15 percent of the primary monitors of each method designation collocated (values of 0.5 and greater round up); and have at least one collocated quality control monitor (if the total number of monitors is less than three). The first collocated monitor must be a designated FRM monitor.
3.2.3.2 In addition, monitors selected for collocation must also meet the following requirements:
(a) A primary monitor designated as an EPA FRM shall be collocated with a quality control monitor having the same EPA FRM method designation.
(b) For each primary monitor designated as an EPA FEM used by the PQAO, 50 percent of the monitors designated for collocation, or the first if only one collocation is necessary, shall be collocated with a FRM quality control monitor and 50 percent of the monitors shall be collocated with a monitor having the same method designation as the FEM primary monitor. If an odd number of collocated monitors is required, the additional monitor shall be a FRM quality control monitor. An example of the distribution of collocated monitors for each unique FEM is provided below. Table A-2 of this appendix demonstrates the collocation procedure with a PQAO having one type of primary FRM and multiple primary FEMs.
| #Primary FEMS of a unique method
designation |
#Collocated | #Collocated with an FRM | #Collocated with same method
designation |
|---|---|---|---|
| 1-9 | 1 | 1 | 0 |
| 10-16 | 2 | 1 | 1 |
| 17-23 | 3 | 2 | 1 |
| 24-29 | 4 | 2 | 2 |
| 30-36 | 5 | 3 | 2 |
| 37-43 | 6 | 3 | 3 |
3.2.3.3 Since the collocation requirements are used to assess precision of the primary monitors and there can only be one primary monitor at a monitoring site, a site can only count for the collocation of the method designation of the primary monitor at that site.
3.2.3.4 The collocated monitors should be deployed according to the following protocol:
(a) Fifty percent of the collocated quality control monitors should be deployed at sites with annual average or daily concentrations estimated to be within plus or minus 20 percent of either the annual or 24-hour NAAQS and the remainder at the PQAOs discretion;
(b) If an organization has no sites with annual average or daily concentrations within ±20 percent of the annual NAAQS or 24-hour NAAQS, 50 percent of the collocated quality control monitors should be deployed at those sites with the annual mean concentrations or 24-hour concentrations among the highest for all sites in the network and the remainder at the PQAOs discretion.
(c) The two collocated monitors must be within 4 meters (inlet to inlet) of each other and at least 2 meters apart for flow rates greater than 200 liters/min or at least 1 meter apart for samplers having flow rates less than 200 liters/min to preclude airflow interference. A waiver allowing up to 10 meters horizontal distance and up to 3 meters vertical distance (inlet to inlet) between a primary and collocated sampler may be approved by the Regional Administrator for sites at a neighborhood or larger scale of representation during the annual network plan approval process. Sampling and analytical methodologies must be the consistently implemented for both primary and collocated quality control samplers and for all other samplers in the network.
(d) Sample the collocated quality control monitor on a 1-in-12 day schedule. Report the measurements from both primary and collocated quality control monitors at each collocated sampling site to AQS. The calculations for evaluating precision between the two collocated monitors are described in section 4.2.1 of this appendix.
3.2.4 PM2.5 Performance Evaluation Program (PEP) Procedures. The PEP is an independent assessment used to estimate total measurement system bias. These evaluations will be performed under the NPEP as described in section 2.4 of this appendix or a comparable program. Performance evaluations will be performed annually within each PQAO. For PQAOs with less than or equal to five monitoring sites, five valid performance evaluation audits must be collected and reported each year. For PQAOs with greater than five monitoring sites, eight valid performance evaluation audits must be collected and reported each year. A valid performance evaluation audit means that both the primary monitor and PEP audit concentrations are valid and above 3 µg/m3. Siting of the PEP monitor must be consistent with section 3.2.3.4(c). However, any horizontal distance greater than 4 meters and any vertical distance greater than one meter must be reported to the EPA regional PEP coordinator. Additionally for every monitor designated as a primary monitor, a primary quality assurance organization must:
3.2.4.1 Have each method designation evaluated each year; and,
3.2.4.2 Have all FRM, FEM or ARM samplers subject to a PEP audit at least once every 6 years, which equates to approximately 15 percent of the monitoring sites audited each year.
3.2.4.3. Additional information concerning the PEP is contained in reference 10 of this appendix. The calculations for evaluating bias between the primary monitor and the performance evaluation monitor for PM2.5 are described in section 4.2.5 of this appendix.
3.3 PM10.
3.3.1 Flow Rate Verification for PM10 Low Volume Samplers (less than 200 liter/minute). A one-point flow rate verification check must be performed at least once every month (each verification minimally separated by 14 days) on each monitor used to measure PM10. The verification is made by checking the operational flow rate of the monitor. If the verification is made in conjunction with a flow rate adjustment, it must be made prior to such flow rate adjustment. For the standard procedure, use a flow rate transfer standard certified in accordance with section 2.6 of this appendix to check the monitor's normal flow rate. Care should be taken in selecting and using the flow rate measurement device such that it does not alter the normal operating flow rate of the monitor. The percent differences between the audit and measured flow rates are reported to AQS and used to assess the bias of the monitoring data as described in section 4.2.2 of this appendix (using flow rates in lieu of concentrations).
3.3.2 Flow Rate Verification for PM10 High Volume Samplers (greater than 200 liters/minute). For PM10 high volume samplers, the verification frequency is one verification every 90 days (quarter) with 4 in a year. Other than verification frequency, follow the same technical procedure as described in section 3.3.1 of this appendix.
3.3.3 Semi-Annual Flow Rate Audit for PM10. Audit the flow rate of the particulate monitor twice a year. The two audits should ideally be spaced between 5 and 7 months apart. The EPA strongly encourages more frequent auditing. The audit should (preferably) be conducted by a trained experienced technician other than the routine site operator. The audit is made by measuring the monitor's normal operating flow rate using a flow rate transfer standard certified in accordance with section 2.6 of this appendix. The flow rate standard used for auditing must not be the same flow rate standard used for verifications or to calibrate the monitor. However, both the calibration standard and the audit standard may be referenced to the same primary flow rate or volume standard. Care must be taken in auditing the flow rate to be certain that the flow measurement device does not alter the normal operating flow rate of the monitor. Report the audit flow rate of the transfer standard and the corresponding flow rate measured by the monitor to AQS. The percent differences between these flow rates are used to evaluate monitor performance.
3.3.4 Collocated Quality Control Sampling Procedures for Manual PM10. Collocated sampling for PM10 is only required for manual samplers. For each pair of collocated monitors, designate one sampler as the primary monitor whose concentrations will be used to report air quality for the site and designate the other as the quality control monitor.
3.3.4.1 For manual PM10 samplers, a PQAO must:
(a) Have 15 percent of the primary monitors collocated (values of 0.5 and greater round up); and
(b) Have at least one collocated quality control monitor (if the total number of monitors is less than three).
3.3.4.2 The collocated quality control monitors should be deployed according to the following protocol:
(a) Fifty percent of the collocated quality control monitors should be deployed at sites with daily concentrations estimated to be within plus or minus 20 percent of the applicable NAAQS and the remainder at the PQAOs discretion;
(b) If an organization has no sites with daily concentrations within plus or minus 20 percent of the NAAQS, 50 percent of the collocated quality control monitors should be deployed at those sites with the daily mean concentrations among the highest for all sites in the network and the remainder at the PQAOs discretion.
(c) The two collocated monitors must be within 4 meters (inlet to inlet) of each other and at least 2 meters apart for flow rates greater than 200 liters/min or at least 1 meter apart for samplers having flow rates less than 200 liters/min to preclude airflow interference. A waiver allowing up to 10 meters horizontal distance and up to 3 meters vertical distance (inlet to inlet) between a primary and collocated sampler may be approved by the Regional Administrator for sites at a neighborhood or larger scale of representation. This waiver may be approved during the annual network plan approval process. Sampling and analytical methodologies must be the consistently implemented for both collocated samplers and for all other samplers in the network.
(d) Sample the collocated quality control monitor on a 1-in-12 day schedule. Report the measurements from both primary and collocated quality control monitors at each collocated sampling site to AQS. The calculations for evaluating precision between the two collocated monitors are described in section 4.2.1 of this appendix.
(e) In determining the number of collocated quality control sites required for PM10, monitoring networks for lead (Pb-PM10) should be treated independently from networks for particulate matter (PM), even though the separate networks may share one or more common samplers. However, a single quality control monitor that meets the collocation requirements for Pb-PM10 and PM10 may serve as a collocated quality control monitor for both networks. Extreme care must be taken when using the filter from a quality control monitor for both PM10 and Pb analysis. A PM10 filter weighing should occur prior to any Pb analysis.
3.4 Pb.
3.4.1 Flow Rate Verification for Pb-PM10 Low Volume Samplers (less than 200 liter/minute). A one-point flow rate verification check must be performed at least once every month (each verification minimally separated by 14 days) on each monitor used to measure Pb. The verification is made by checking the operational flow rate of the monitor. If the verification is made in conjunction with a flow rate adjustment, it must be made prior to such flow rate adjustment. For the standard procedure, use a flow rate transfer standard certified in accordance with section 2.6 of this appendix to check the monitor's normal flow rate. Care should be taken in selecting and using the flow rate measurement device such that it does not alter the normal operating flow rate of the monitor. The percent differences between the audit and measured flow rates are reported to AQS and used to assess the bias of the monitoring data as described in section 4.2.2 of this appendix (using flow rates in lieu of concentrations).
3.4.2 Flow Rate Verification for Pb High Volume Samplers (greater than 200 liters/minute). For high volume samplers, the verification frequency is one verification every 90 days (quarter) with four in a year. Other than verification frequency, follow the same technical procedure as described in section 3.4.1 of this appendix.
3.4.3 Semi-Annual Flow Rate Audit for Pb. Audit the flow rate of the particulate monitor twice a year. The two audits should ideally be spaced between 5 and 7 months apart. The EPA strongly encourages more frequent auditing. The audit should (preferably) be conducted by a trained experienced technician other than the routine site operator. The audit is made by measuring the monitor's normal operating flow rate using a flow rate transfer standard certified in accordance with section 2.6 of this appendix. The flow rate standard used for auditing must not be the same flow rate standard used for verifications or to calibrate the monitor. However, both the calibration standard and the audit standard may be referenced to the same primary flow rate or volume standard. Care must be taken in auditing the flow rate to be certain that the flow measurement device does not alter the normal operating flow rate of the monitor. Report the audit flow rate of the transfer standard and the corresponding flow rate measured by the monitor to AQS. The percent differences between these flow rates are used to evaluate monitor performance.
3.4.4 Collocated Quality Control Sampling for TSP Pb for monitoring sites other than non-source oriented NCore. For each pair of collocated monitors for manual TSP Pb samplers, designate one sampler as the primary monitor whose concentrations will be used to report air quality for the site, and designate the other as the quality control monitor.
3.4.4.1 A PQAO must:
(a) Have 15 percent of the primary monitors (not counting non-source oriented NCore sites in PQAO) collocated. Values of 0.5 and greater round up; and
(b) Have at least one collocated quality control monitor (if the total number of monitors is less than three).
3.4.4.2 The collocated quality control monitors should be deployed according to the following protocol:
(a) The first collocated Pb site selected must be the site measuring the highest Pb concentrations in the network. If the site is impractical, alternative sites, approved by the EPA Regional Administrator, may be selected. If additional collocated sites are necessary, collocated sites may be chosen that reflect average ambient air Pb concentrations in the network.
(b) The two collocated monitors must be within 4 meters (inlet to inlet) of each other and at least 2 meters apart for flow rates greater than 200 liters/min or at least 1 meter apart for samplers having flow rates less than 200 liters/min to preclude airflow interference.
(c) Sample the collocated quality control monitor on a 1-in-12 day schedule. Report the measurements from both primary and collocated quality control monitors at each collocated sampling site to AQS. The calculations for evaluating precision between the two collocated monitors are described in section 4.2.1 of this appendix.
3.4.5 Collocated Quality Control Sampling for Pb-PM10 at monitoring sites other than non-source oriented NCore. If a PQAO is monitoring for Pb-PM10 at sites other than at a non-source oriented NCore site then the PQAO must:
3.4.5.1 Have 15 percent of the primary monitors (not counting non-source oriented NCore sites in PQAO) collocated. Values of 0.5 and greater round up; and
3.4.5.2 Have at least one collocated quality control monitor (if the total number of monitors is less than three).
3.4.5.3 The collocated monitors should be deployed according to the following protocol:
(a) Fifty percent of the collocated quality control monitors should be deployed at sites with the highest 3-month average concentrations and the remainder at the PQAOs discretion.
(b) The two collocated monitors must be within 4 meters (inlet to inlet) of each other and at least 2 meters apart for flow rates greater than 200 liters/min or at least 1 meter apart for samplers having flow rates less than 200 liters/min to preclude airflow interference. A waiver allowing up to 10 meters horizontal distance and up to 3 meters vertical distance (inlet to inlet) between a primary and collocated sampler may be approved by the Regional Administrator for sites at a neighborhood or larger scale of representation. This waiver may be approved during the annual network plan approval process. Sampling and analytical methodologies must be the consistently implemented for both collocated samplers and for all other samplers in the network.
(c) Sample the collocated quality control monitor on a 1-in-12 day schedule. Report the measurements from both primary and collocated quality control monitors at each collocated sampling site to AQS. The calculations for evaluating precision between the two collocated monitors are described in section 4.2.1 of this appendix.
(d) In determining the number of collocated quality control sites required for Pb-PM10, monitoring networks for PM10 should be treated independently from networks for Pb-PM10, even though the separate networks may share one or more common samplers. However, a single quality control monitor that meets the collocation requirements for Pb-PM10 and PM10 may serve as a collocated quality control monitor for both networks. Extreme care must be taken when using a using the filter from a quality control monitor for both PM10 and Pb analysis. A PM10 filter weighing should occur prior to any Pb analysis.
3.4.6 Pb Analysis Audits. Each calendar quarter, audit the Pb reference or equivalent method analytical procedure using filters containing a known quantity of Pb. These audit filters are prepared by depositing a Pb standard on unexposed filters and allowing them to dry thoroughly. The audit samples must be prepared using batches of reagents different from those used to calibrate the Pb analytical equipment being audited. Prepare audit samples in the following concentration ranges:
| Range | Equivalent ambient Pb
concentration, µg/m3 |
|---|---|
| 1 | 30-100% of Pb NAAQS. |
| 2 | 200-300% of Pb NAAQS. |
(a) Extract the audit samples using the same extraction procedure used for exposed filters.
(b) Analyze three audit samples in each of the two ranges each quarter samples are analyzed. The audit sample analyses shall be distributed as much as possible over the entire calendar quarter.
(c) Report the audit concentrations (in µg Pb/filter or strip) and the corresponding measured concentrations (in µg Pb/filter or strip) to AQS using AQS unit code 077. The percent differences between the concentrations are used to calculate analytical accuracy as described in section 4.2.6 of this appendix.
3.4.7 Pb PEP Procedures for monitoring sites other than non-source oriented NCore. The PEP is an independent assessment used to estimate total measurement system bias. These evaluations will be performed under the NPEP described in section 2.4 of this appendix or a comparable program. Each year, one performance evaluation audit must be performed at one Pb site in each primary quality assurance organization that has less than or equal to five sites and two audits at PQAOs with greater than five sites. Non-source oriented NCore sites are not counted. Siting of the PEP monitor must be consistent with section 3.4.5.3(b). However, any horizontal distance greater than 4 meters and any vertical distance greater than 1 meter must be reported to the EPA regional PEP coordinator. In addition, each year, four collocated samples from PQAOs with less than or equal to five sites and six collocated samples at PQAOs with greater than five sites must be sent to an independent laboratory, the same laboratory as the performance evaluation audit, for analysis. The calculations for evaluating bias between the primary monitor and the performance evaluation monitor for Pb are described in section 4.2.4 of this appendix.
4. Calculations for Data Quality Assessments
(a) Calculations of measurement uncertainty are carried out by the EPA according to the following procedures. The PQAOs must report the data to AQS for all measurement quality checks as specified in this appendix even though they may elect to perform some or all of the calculations in this section on their own.
(b) The EPA will provide annual assessments of data quality aggregated by site and PQAO for SO2, NO2, O3 and CO and by PQAO for PM10, PM2.5, and Pb.
(c) At low concentrations, agreement between the measurements of collocated quality control samplers, expressed as relative percent difference or percent difference, may be relatively poor. For this reason, collocated measurement pairs are selected for use in the precision and bias calculations only when both measurements are equal to or above the following limits:
(1) Pb: 0.002 µg/m3 (Methods approved after 3/04/2010, with exception of manual equivalent method EQLA-0813-803).
(2) Pb: 0.02 µg/m3 (Methods approved before 3/04/2010, and manual equivalent method EQLA-0813-803).
(3) PM10 (Hi-Vol): 15 µg/m3.
(4) PM10 (Lo-Vol): 3 µg/m3.
(5) PM2.5: 3 µg/m3.
4.1 Statistics for the Assessment of QC Checks for SO2, NO2, O3 and CO.
4.1.1 Percent Difference. Many of the measurement quality checks start with a comparison of an audit concentration or value (flow rate) to the concentration/value measured by the monitor and use percent difference as the comparison statistic as described in equation 1 of this section. For each single point check, calculate the percent difference, di, as follows:
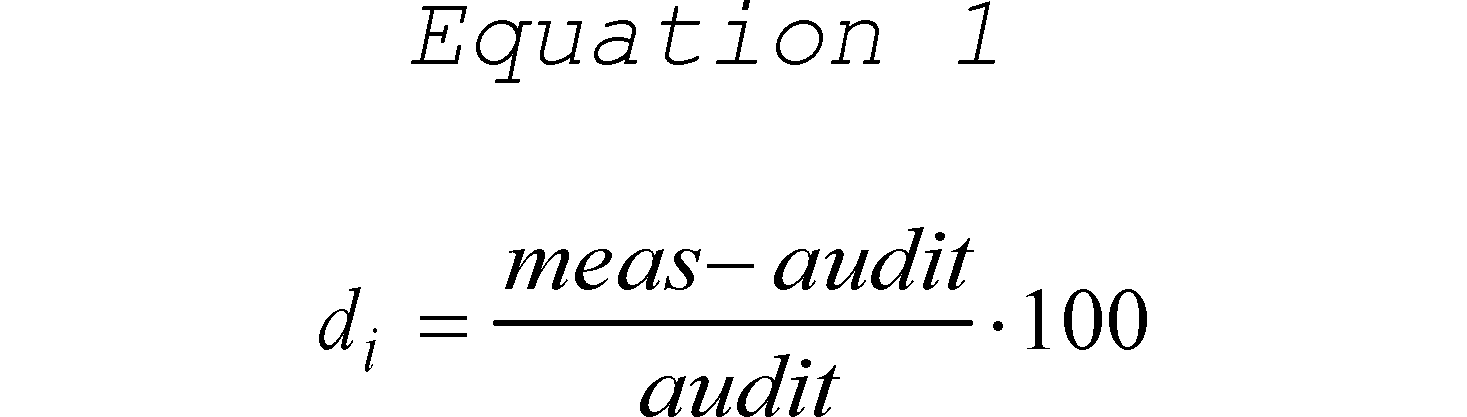
where meas is the concentration indicated by the PQAO's instrument and audit is the audit concentration of the standard used in the QC check being measured.
4.1.2 Precision Estimate. The precision estimate is used to assess the one-point QC checks for SO2, NO2, O3, or CO described in section 3.1.1 of this appendix. The precision estimator is the coefficient of variation upper bound and is calculated using equation 2 of this section:
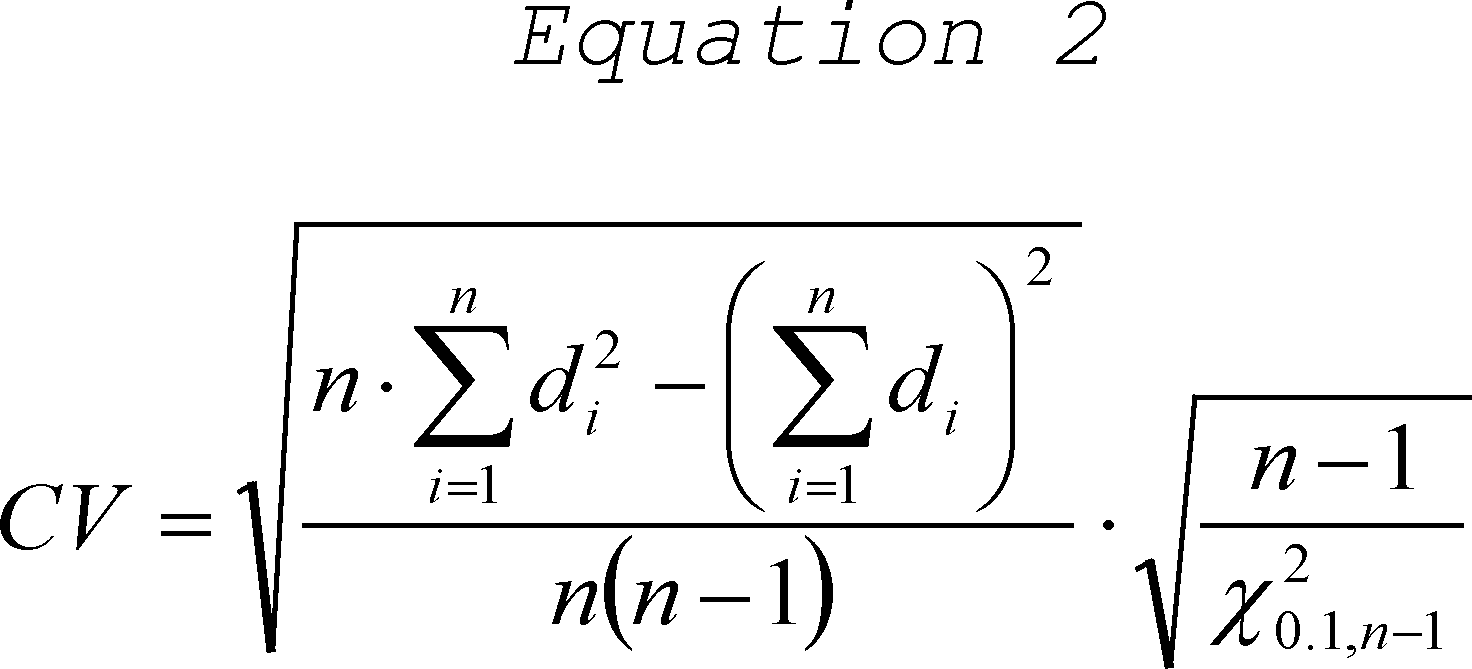
where n is the number of single point checks being aggregated; X20.1,n-1 is the 10th percentile of a chi-squared distribution with n-1 degrees of freedom.
4.1.3 Bias Estimate. The bias estimate is calculated using the one-point QC checks for SO2, NO2, O3, or CO described in section 3.1.1 of this appendix. The bias estimator is an upper bound on the mean absolute value of the percent differences as described in equation 3 of this section:
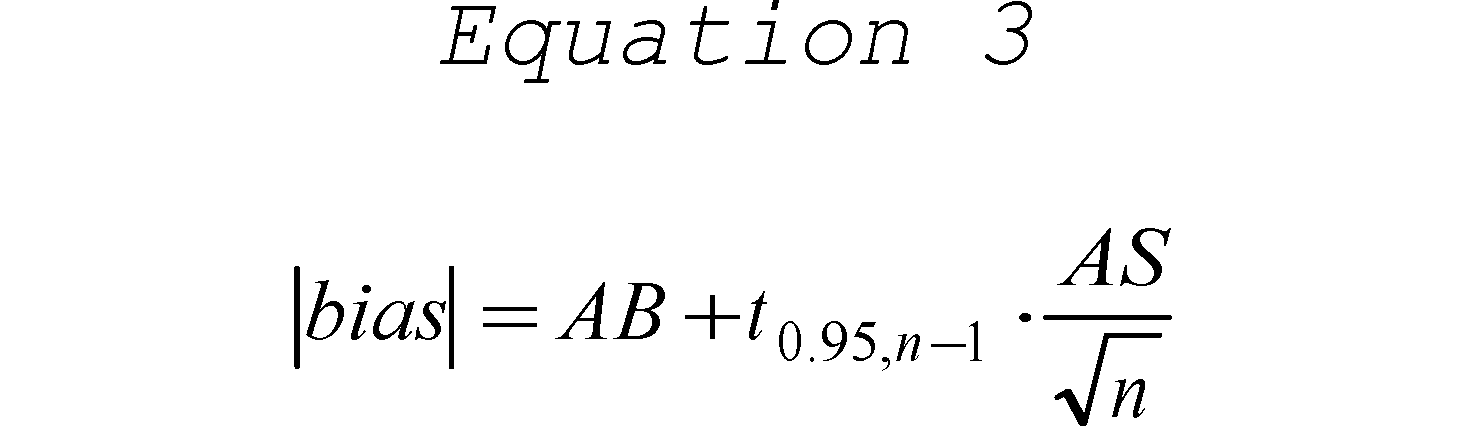
where n is the number of single point checks being aggregated; t0.95,n-1 is the 95th quantile of a t-distribution with n-1 degrees of freedom; the quantity AB is the mean of the absolute values of the di ′ s and is calculated using equation 4 of this section:

and the quantity AS is the standard deviation of the absolute value of the di ′ s and is calculated using equation 5 of this section:

4.1.3.1 Assigning a sign (positive/negative) to the bias estimate. Since the bias statistic as calculated in equation 3 of this appendix uses absolute values, it does not have a tendency (negative or positive bias) associated with it. A sign will be designated by rank ordering the percent differences of the QC check samples from a given site for a particular assessment interval.
4.1.3.2 Calculate the 25th and 75th percentiles of the percent differences for each site. The absolute bias upper bound should be flagged as positive if both percentiles are positive and negative if both percentiles are negative. The absolute bias upper bound would not be flagged if the 25th and 75th percentiles are of different signs.
4.2 Statistics for the Assessment of PM10, PM2.5, and Pb.
4.2.1 Collocated Quality Control Sampler Precision Estimate for PM10, PM2.5 and Pb. Precision is estimated via duplicate measurements from collocated samplers. It is recommended that the precision be aggregated at the PQAO level quarterly, annually, and at the 3-year level. The data pair would only be considered valid if both concentrations are greater than or equal to the minimum values specified in section 4(c) of this appendix. For each collocated data pair, calculate the relative percent difference, di, using equation 6 of this appendix:
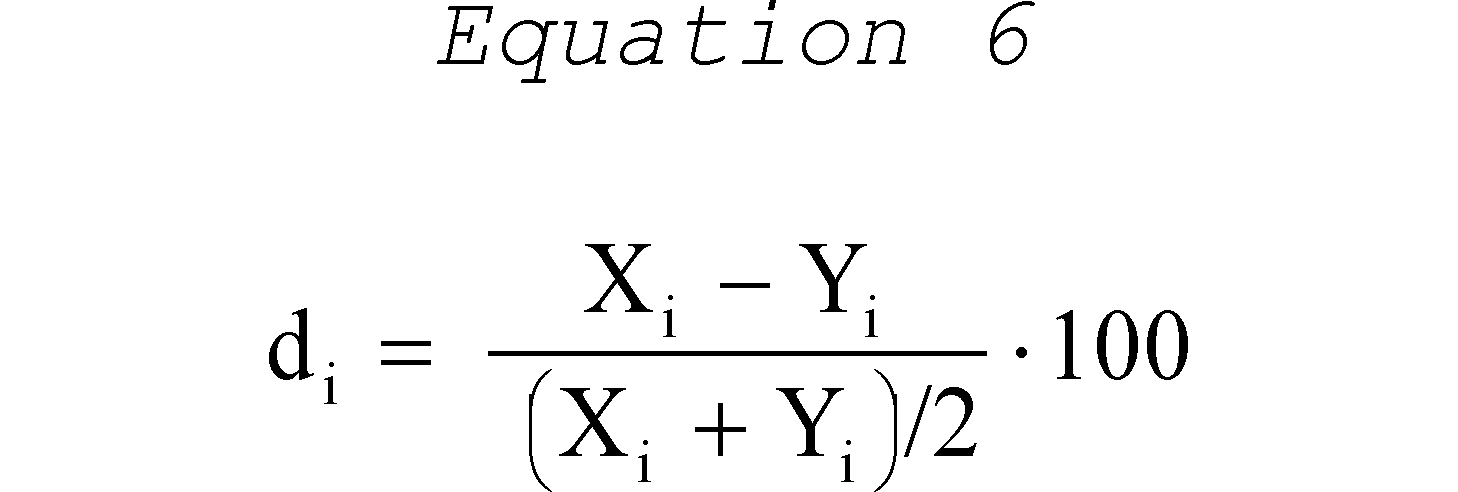
where Xi is the concentration from the primary sampler and Yi is the concentration value from the audit sampler. The coefficient of variation upper bound is calculated using equation 7 of this appendix:

where n is the number of valid data pairs being aggregated, and X20.1,n-1 is the 10th percentile of a chi-squared distribution with n-1 degrees of freedom. The factor of 2 in the denominator adjusts for the fact that each di is calculated from two values with error.
4.2.2 One-Point Flow Rate Verification Bias Estimate for PM10, PM2.5 and Pb. For each one-point flow rate verification, calculate the percent difference in volume using equation 1 of this appendix where meas is the value indicated by the sampler's volume measurement and audit is the actual volume indicated by the auditing flow meter. The absolute volume bias upper bound is then calculated using equation 3, where n is the number of flow rate audits being aggregated; t0.95,n-1 is the 95th quantile of a t-distribution with n-1 degrees of freedom, the quantity AB is the mean of the absolute values of the di′s and is calculated using equation 4 of this appendix, and the quantity AS in equation 3 of this appendix is the standard deviation of the absolute values if the di′s and is calculated using equation 5 of this appendix.
4.2.3 Semi-Annual Flow Rate Audit Bias Estimate for PM10, PM2.5 and Pb. Use the same procedure described in section 4.2.2 for the evaluation of flow rate audits.
4.2.4 Performance Evaluation Programs Bias Estimate for Pb. The Pb bias estimate is calculated using the paired routine and the PEP monitor as described in section 3.4.7. Use the same procedures as described in section 4.1.3 of this appendix.
4.2.5 Performance Evaluation Programs Bias Estimate for PM2.5. The bias estimate is calculated using the PEP audits described in section 4.1.3 of this appendix. The bias estimator is based on the mean percent differences (Equation 1). The mean percent difference, D, is calculated by Equation 8 below.

where nj is the number of pairs and d1,d2,...dnj are the biases for each pair to be averaged.
4.2.6 Pb Analysis Audit Bias Estimate. The bias estimate is calculated using the analysis audit data described in section 3.4.6. Use the same bias estimate procedure as described in section 4.1.3 of this appendix.
5. Reporting Requirements
5.1 Reporting Requirements. For each pollutant, prepare a list of all monitoring sites and their AQS site identification codes in each PQAO and submit the list to the appropriate EPA Regional Office, with a copy to AQS. Whenever there is a change in this list of monitoring sites in a PQAO, report this change to the EPA Regional Office and to AQS.
5.1.1 Quarterly Reports. For each quarter, each PQAO shall report to AQS directly (or via the appropriate EPA Regional Office for organizations not direct users of AQS) the results of all valid measurement quality checks it has carried out during the quarter. The quarterly reports must be submitted consistent with the data reporting requirements specified for air quality data as set forth in 40 CFR 58.16. The EPA strongly encourages early submission of the quality assurance data in order to assist the PQAOs ability to control and evaluate the quality of the ambient air data.
5.1.2 Annual Reports.
5.1.2.1 When the PQAO has certified relevant data for the calendar year, the EPA will calculate and report the measurement uncertainty for the entire calendar year.
6. References
(1) American National Standard—Specifications and Guidelines for Quality Systems for Environmental Data Collection and Environmental Technology Programs. ANSI/ASQC E4-2014. February 2014. Available from American Society for Quality Control, 611 East Wisconsin Avenue, Milwaukee, WI 53202.
(2) EPA Requirements for Quality Management Plans. EPA QA/R-2. EPA/240/B-01/002. March 2001, Reissue May 2006. Office of Environmental Information, Washington DC 20460. http://www.epa.gov/quality/agency-wide-quality-system-documents.
(3) EPA Requirements for Quality Assurance Project Plans for Environmental Data Operations. EPA QA/R-5. EPA/240/B-01/003. March 2001, Reissue May 2006. Office of Environmental Information, Washington DC 20460. http://www.epa.gov/quality/agency-wide-quality-system-documents.
(4) EPA Traceability Protocol for Assay and Certification of Gaseous Calibration Standards. EPA-600/R-12/531. May, 2012. Available from U.S. Environmental Protection Agency, National Risk Management Research Laboratory, Research Triangle Park NC 27711. http://cfpub.epa.gov/si/si_public_record_report.cfm?dirEntryId=245292.
(5) Guidance for the Data Quality Objectives Process. EPA QA/G-4. EPA/240/B-06/001. February, 2006. Office of Environmental Information, Washington DC 20460. http://www.epa.gov/quality/agency-wide-quality-system-documents.
(6) List of Designated Reference and Equivalent Methods. Available from U.S. Environmental Protection Agency, National Exposure Research Laboratory, Human Exposure and Atmospheric Sciences Division, MD-D205-03, Research Triangle Park, NC 27711. http://www3.epa.gov/ttn/amtic/criteria.html.
(7) Transfer Standards for the Calibration of Ambient Air Monitoring Analyzers for Ozone. EPA-454/B-13-004 U.S. Environmental Protection Agency, Research Triangle Park, NC 27711, October, 2013. http://www3.epa.gov/ttn/amtic/qapollutant.html.
(8) Paur, R.J. and F.F. McElroy. Technical Assistance Document for the Calibration of Ambient Ozone Monitors. EPA-600/4-79-057. U.S. Environmental Protection Agency, Research Triangle Park, NC 27711, September, 1979. http://www.epa.gov/ttn/amtic/cpreldoc.html.
(9) Quality Assurance Handbook for Air Pollution Measurement Systems, Volume 1—A Field Guide to Environmental Quality Assurance. EPA-600/R-94/038a. April 1994. Available from U.S. Environmental Protection Agency, ORD Publications Office, Center for Environmental Research Information (CERI), 26 W. Martin Luther King Drive, Cincinnati, OH 45268. http://www3.epa.gov/ttn/amtic/qalist.html.
(10) Quality Assurance Handbook for Air Pollution Measurement Systems, Volume II: Ambient Air Quality Monitoring Program Quality System Development. EPA-454/B-13-003. http://www3.epa.gov/ttn/amtic/qalist.html.
(11) National Performance Evaluation Program Standard Operating Procedures. http://www3.epa.gov/ttn/amtic/npapsop.html.
Table A-1 of Appendix A to Part 58—Minimum Data Assessment Requirements for NAAQS Related Criteria Pollutant Monitors
| Method | Assessment method | Coverage | Minimum
frequency |
Parameters
reported |
AQS assessment type |
|---|---|---|---|---|---|
| Gaseous Methods (CO, NO 2, SO 2, O 3) | |||||
| One-Point QC for SO2, NO2, O3, CO | Response check at concentration 0.005-0.08 ppm SO2, NO2, O3, and
0.5 and 5 ppm CO |
Each analyzer | Once per 2 weeks | Audit concentration1 and measured concentration.2 | One-Point QC. |
| Annual performance evaluation for SO2, NO2, O3, CO | See section 3.1.2 of this appendix | Each analyzer | Once per year | Audit concentration1 and measured concentration2 for each level | Annual PE. |
| NPAP for SO2, NO2, O3, CO | Independent Audit | 20% of sites each year | Once per year | Audit concentration1 and measured concentration2 for each level | NPAP. |
| Particulate Methods | |||||
| Continuous4 method—collocated quality control sampling PM2.5 | Collocated samplers | 15% | 1-in-12 days | Primary sampler concentration and duplicate sampler concentration.3 | No Transaction reported as raw data. |
| Manual method—collocated quality control sampling PM10, PM2.5, Pb-TSP, Pb-PM10 | Collocated samplers | 15% | 1-in-12 days | Primary sampler concentration and duplicate sampler concentration.3 | No Transaction reported as raw data. |
| Flow rate verification PM10 (low Vol) PM2.5, Pb-PM10 | Check of sampler flow rate | Each sampler | Once every month | Audit flow rate and measured flow rate indicated by the sampler | Flow Rate Verification. |
| Flow rate verification PM10 (High-Vol), Pb-TSP | Check of sampler flow rate | Each sampler | Once every quarter | Audit flow rate and measured flow rate indicated by the sampler | Flow Rate Verification. |
| Semi-annual flow rate audit PM10, TSP, PM10-2.5, PM2.5, Pb-TSP, Pb-PM10 | Check of sampler flow rate using independent standard | Each sampler, | Once every 6 months | Audit flow rate and measured flow rate indicated by the sampler | Semi Annual Flow Rate Audit. |
| Pb analysis audits Pb-TSP, Pb-PM10 | Check of analytical system with Pb audit strips/filters | Analytical | Once each quarter | Measured value and audit value (ug Pb/filter) using AQS unit code 077 | Pb Analysis Audits. |
| Performance Evaluation Program PM2.5 | Collocated samplers | (1) 5 valid audits for primary QA orgs, with ≤5 sites.
(2) 8 valid audits for primary QA orgs, with >5 sites. (3) All samplers in 6 years |
Distributed over all 4 quarters | Primary sampler concentration and performance evaluation sampler concentration | PEP. |
| Performance Evaluation Program Pb-TSP, Pb-PM10 | Collocated samplers | (1) 1 valid audit and 4 collocated samples for primary QA orgs, with ≤5 sites.
(2) 2 valid audits and 6 collocated samples for primary QA orgs with >5 sites |
Distributed over all 4 quarters | Primary sampler concentration and performance evaluation sampler concentration. Primary sampler concentration and duplicate sampler concentration | PEP. |
Table A-2 of Appendix A to Part 58—Summary of PM2.5 Number and Type of Collocation (15% Collocation Requirement) Required Using an Example of a PQAO That Has 54 Primary Monitors (54 sites) With One Federal Reference Method Type and Three Types of Approved Federal Equivalent Methods
| Primary sampler method designation | Total No. of monitors | Total No. of collocated | No. of
collocated with FRM |
No. of
collocated with same method designation as primary |
|---|---|---|---|---|
| FRM | 20 | 3 | 3 | 3 |
| FEM (A) | 20 | 3 | 2 | 1 |
| FEM (B) | 2 | 1 | 1 | 0 |
| FEM (C) | 12 | 2 | 1 | 1 |
[81 FR 17280, Mar. 28, 2016]
Appendix B to Part 58—Quality Assurance Requirements for Prevention of Significant Deterioration (PSD) Air Monitoring
1. General Information
2. Quality System Requirements
3. Measurement Quality Check Requirements
4. Calculations for Data Quality Assessments
5. Reporting Requirements
6. References
1. General Information
1.1 Applicability.
(a) This appendix specifies the minimum quality assurance requirements for the control and assessment of the quality of the ambient air monitoring data submitted to a PSD reviewing authority or the EPA by an organization operating an air monitoring station, or network of stations, operated in order to comply with Part 51 New Source Review—Prevention of Significant Deterioration (PSD). Such organizations are encouraged to develop and maintain quality assurance programs more extensive than the required minimum. Additional guidance for the requirements reflected in this appendix can be found in the “Quality Assurance Handbook for Air Pollution Measurement Systems,” Volume II (Ambient Air) and “Quality Assurance Handbook for Air Pollution Measurement Systems,” Volume IV (Meteorological Measurements) and at a national level in references 1, 2, and 3 of this appendix.
(b) It is not assumed that data generated for PSD under this appendix will be used in making NAAQS decisions. However, if all the requirements in this appendix are followed (including the NPEP programs) and reported to AQS, with review and concurrence from the EPA region, data may be used for NAAQS decisions. With the exception of the NPEP programs (NPAP, PM2.5 PEP, Pb-PEP), for which implementation is at the discretion of the PSD reviewing authority, all other quality assurance and quality control requirements found in the appendix must be met.
1.2 PSD Primary Quality Assurance Organization (PQAO). A PSD PQAO is defined as a monitoring organization or a coordinated aggregation of such organizations that is responsible for a set of stations within one PSD reviewing authority that monitors the same pollutant and for which data quality assessments will be pooled. Each criteria pollutant sampler/monitor must be associated with only one PSD PQAO.
1.2.1 Each PSD PQAO shall be defined such that measurement uncertainty among all stations in the organization can be expected to be reasonably homogeneous, as a result of common factors. A PSD PQAO must be associated with only one PSD reviewing authority. Common factors that should be considered in defining PSD PQAOs include:
(a) Operation by a common team of field operators according to a common set of procedures;
(b) Use of a common QAPP and/or standard operating procedures;
(c) Common calibration facilities and standards;
(d) Oversight by a common quality assurance organization; and
(e) Support by a common management organization or laboratory.
1.2.2 PSD monitoring organizations having difficulty describing its PQAO or in assigning specific monitors to a PSD PQAO should consult with the PSD reviewing authority. Any consolidation of PSD PQAOs shall be subject to final approval by the PSD reviewing authority.
1.2.3 Each PSD PQAO is required to implement a quality system that provides sufficient information to assess the quality of the monitoring data. The quality system must, at a minimum, include the specific requirements described in this appendix. Failure to conduct or pass a required check or procedure, or a series of required checks or procedures, does not by itself invalidate data for regulatory decision making. Rather, PSD PQAOs and the PSD reviewing authority shall use the checks and procedures required in this appendix in combination with other data quality information, reports, and similar documentation that demonstrate overall compliance with parts 51, 52 and 58 of this chapter. Accordingly, the PSD reviewing authority shall use a “weight of evidence” approach when determining the suitability of data for regulatory decisions. The PSD reviewing authority reserves the authority to use or not use monitoring data submitted by a PSD monitoring organization when making regulatory decisions based on the PSD reviewing authority's assessment of the quality of the data. Generally, consensus built validation templates or validation criteria already approved in quality assurance project plans (QAPPs) should be used as the basis for the weight of evidence approach.
1.3 Definitions.
(a) Measurement Uncertainty. A term used to describe deviations from a true concentration or estimate that are related to the measurement process and not to spatial or temporal population attributes of the air being measured.
(b) Precision. A measurement of mutual agreement among individual measurements of the same property usually under prescribed similar conditions, expressed generally in terms of the standard deviation.
(c) Bias. The systematic or persistent distortion of a measurement process which causes errors in one direction.
(d) Accuracy. The degree of agreement between an observed value and an accepted reference value. Accuracy includes a combination of random error (imprecision) and systematic error (bias) components which are due to sampling and analytical operations.
(e) Completeness. A measure of the amount of valid data obtained from a measurement system compared to the amount that was expected to be obtained under correct, normal conditions.
(f) Detectability. The low critical range value of a characteristic that a method specific procedure can reliably discern.
1.4 Measurement Quality Check Reporting. The measurement quality checks described in section 3 of this appendix, are required to be submitted to the PSD reviewing authority within the same time frame as routinely-collected ambient concentration data as described in 40 CFR 58.16. The PSD reviewing authority may as well require that the measurement quality check data be reported to AQS.
1.5 Assessments and Reports. Periodic assessments and documentation of data quality are required to be reported to the PSD reviewing authority. To provide national uniformity in this assessment and reporting of data quality for all networks, specific assessment and reporting procedures are prescribed in detail in sections 3, 4, and 5 of this appendix.
2. Quality System Requirements
A quality system (reference 1 of this appendix) is the means by which an organization manages the quality of the monitoring information it produces in a systematic, organized manner. It provides a framework for planning, implementing, assessing and reporting work performed by an organization and for carrying out required quality assurance and quality control activities.
2.1 Quality Assurance Project Plans. All PSD PQAOs must develop a quality system that is described and approved in quality assurance project plans (QAPP) to ensure that the monitoring results:
(a) Meet a well-defined need, use, or purpose (reference 5 of this appendix);
(b) Provide data of adequate quality for the intended monitoring objectives;
(c) Satisfy stakeholder expectations;
(d) Comply with applicable standards specifications;
(e) Comply with statutory (and other legal) requirements; and
(f) Assure quality assurance and quality control adequacy and independence.
2.1.1 The QAPP is a formal document that describes these activities in sufficient detail and is supported by standard operating procedures. The QAPP must describe how the organization intends to control measurement uncertainty to an appropriate level in order to achieve the objectives for which the data are collected. The QAPP must be documented in accordance with EPA requirements (reference 3 of this appendix).
2.1.2 The PSD PQAO's quality system must have adequate resources both in personnel and funding to plan, implement, assess and report on the achievement of the requirements of this appendix and it's approved QAPP.
2.1.3 Incorporation of quality management plan (QMP) elements into the QAPP. The QMP describes the quality system in terms of the organizational structure, functional responsibilities of management and staff, lines of authority, and required interfaces for those planning, implementing, assessing and reporting activities involving environmental data operations (EDO). The PSD PQAOs may combine pertinent elements of the QMP into the QAPP rather than requiring the submission of both QMP and QAPP documents separately, with prior approval of the PSD reviewing authority. Additional guidance on QMPs can be found in reference 2 of this appendix.
2.2 Independence of Quality Assurance Management. The PSD PQAO must provide for a quality assurance management function for its PSD data collection operation, that aspect of the overall management system of the organization that determines and implements the quality policy defined in a PSD PQAO's QAPP. Quality management includes strategic planning, allocation of resources and other systematic planning activities (e.g., planning, implementation, assessing and reporting) pertaining to the quality system. The quality assurance management function must have sufficient technical expertise and management authority to conduct independent oversight and assure the implementation of the organization's quality system relative to the ambient air quality monitoring program and should be organizationally independent of environmental data generation activities.
2.3 Data Quality Performance Requirements.
2.3.1 Data Quality Objectives (DQOs). The DQOs, or the results of other systematic planning processes, are statements that define the appropriate type of data to collect and specify the tolerable levels of potential decision errors that will be used as a basis for establishing the quality and quantity of data needed to support air monitoring objectives (reference 5 of the appendix). The DQOs have been developed by the EPA to support attainment decisions for comparison to national ambient air quality standards (NAAQS). The PSD reviewing authority and the PSD monitoring organization will be jointly responsible for determining whether adherence to the EPA developed NAAQS DQOs specified in appendix A of this part are appropriate or if DQOs from a project-specific systematic planning process are necessary.
2.3.1.1 Measurement Uncertainty for Automated and Manual PM2.5 Methods. The goal for acceptable measurement uncertainty for precision is defined as an upper 90 percent confidence limit for the coefficient of variation (CV) of 10 percent and plus or minus 10 percent for total bias.
2.3.1.2 Measurement Uncertainty for Automated Ozone Methods. The goal for acceptable measurement uncertainty is defined for precision as an upper 90 percent confidence limit for the CV of 7 percent and for bias as an upper 95 percent confidence limit for the absolute bias of 7 percent.
2.3.1.3 Measurement Uncertainty for Pb Methods. The goal for acceptable measurement uncertainty is defined for precision as an upper 90 percent confidence limit for the CV of 20 percent and for bias as an upper 95 percent confidence limit for the absolute bias of 15 percent.
2.3.1.4 Measurement Uncertainty for NO2. The goal for acceptable measurement uncertainty is defined for precision as an upper 90 percent confidence limit for the CV of 15 percent and for bias as an upper 95 percent confidence limit for the absolute bias of 15 percent.
2.3.1.5 Measurement Uncertainty for SO 2. The goal for acceptable measurement uncertainty for precision is defined as an upper 90 percent confidence limit for the CV of 10 percent and for bias as an upper 95 percent confidence limit for the absolute bias of 10 percent.
2.4 National Performance Evaluation Program. Organizations operating PSD monitoring networks are required to implement the EPA's national performance evaluation program (NPEP) if the data will be used for NAAQS decisions and at the discretion of the PSD reviewing authority if PSD data are not used for NAAQS decisions. The NPEP includes the National Performance Audit Program (NPAP), the PM2.5 Performance Evaluation Program (PM2.5-PEP) and the Pb Performance Evaluation Program (Pb-PEP). The PSD QAPP shall provide for the implementation of NPEP including the provision of adequate resources for such NPEP if the data will be used for NAAQS decisions or if required by the PSD reviewing authority. Contact the PSD reviewing authority to determine the best procedure for implementing the audits which may include an audit by the PSD reviewing authority, a contractor certified for the activity, or through self-implementation which is described in sections below. A determination of which entity will be performing this audit program should be made as early as possible and during the QAPP development process. The PSD PQAOs, including contractors that plan to implement these programs on behalf of PSD PQAOs, that plan to implement these programs (self-implement) rather than use the federal programs, must meet the adequacy requirements found in the appropriate sections that follow, as well as meet the definition of independent assessment that follows.
2.4.1 Independent Assessment. An assessment performed by a qualified individual, group, or organization that is not part of the organization directly performing and accountable for the work being assessed. This auditing organization must not be involved with the generation of the routinely-collected ambient air monitoring data. An organization can conduct the performance evaluation (PE) if it can meet this definition and has a management structure that, at a minimum, will allow for the separation of its routine sampling personnel from its auditing personnel by two levels of management. In addition, the sample analysis of audit filters must be performed by a laboratory facility and laboratory equipment separate from the facilities used for routine sample analysis. Field and laboratory personnel will be required to meet the performance evaluation field and laboratory training and certification requirements. The PSD PQAO will be required to participate in the centralized field and laboratory standards certification and comparison processes to establish comparability to federally implemented programs.
2.5 Technical Systems Audit Program. The PSD reviewing authority or the EPA may conduct system audits of the ambient air monitoring programs or organizations operating PSD networks. The PSD monitoring organizations shall consult with the PSD reviewing authority to verify the schedule of any such technical systems audit. Systems audit programs are described in reference 10 of this appendix.
2.6 Gaseous and Flow Rate Audit Standards.
2.6.1 Gaseous pollutant concentration standards (permeation devices or cylinders of compressed gas) used to obtain test concentrations for carbon monoxide (CO), sulfur dioxide (SO2), nitrogen oxide (NO), and nitrogen dioxide (NO2) must be traceable to either a National Institute of Standards and Technology (NIST) Traceable Reference Material (NTRM) or a NIST-certified Gas Manufacturer's Internal Standard (GMIS), certified in accordance with one of the procedures given in reference 4 of this appendix. Vendors advertising certification with the procedures provided in reference 4 of this appendix and distributing gases as “EPA Protocol Gas” must participate in the EPA Protocol Gas Verification Program or not use “EPA” in any form of advertising. The PSD PQAOs must provide information to the PSD reviewing authority on the gas vendors they use (or will use) for the duration of the PSD monitoring project. This information can be provided in the QAPP or monitoring plan, but must be updated if there is a change in the producer used.
2.6.2 Test concentrations for ozone (O3) must be obtained in accordance with the ultraviolet photometric calibration procedure specified in appendix D to Part 50, and by means of a certified NIST-traceable O3 transfer standard. Consult references 7 and 8 of this appendix for guidance on transfer standards for O3.
2.6.3 Flow rate measurements must be made by a flow measuring instrument that is NIST-traceable to an authoritative volume or other applicable standard. Guidance for certifying some types of flow-meters is provided in reference 10 of this appendix.
2.7 Primary Requirements and Guidance. Requirements and guidance documents for developing the quality system are contained in references 1 through 11 of this appendix, which also contain many suggested procedures, checks, and control specifications. Reference 10 describes specific guidance for the development of a quality system for data collected for comparison to the NAAQS. Many specific quality control checks and specifications for methods are included in the respective reference methods described in Part 50 or in the respective equivalent method descriptions available from the EPA (reference 6 of this appendix). Similarly, quality control procedures related to specifically designated reference and equivalent method monitors are contained in the respective operation or instruction manuals associated with those monitors. For PSD monitoring, the use of reference and equivalent method monitors are required.
3. Measurement Quality Check Requirements
This section provides the requirements for PSD PQAOs to perform the measurement quality checks that can be used to assess data quality. Data from these checks are required to be submitted to the PSD reviewing authority within the same time frame as routinely-collected ambient concentration data as described in 40 CFR 58.16. Table B-1 of this appendix provides a summary of the types and frequency of the measurement quality checks that are described in this section. Reporting these results to AQS may be required by the PSD reviewing authority.
3.1 Gaseous monitors of SO2, NO2, O3, and CO.
3.1.1 One-Point Quality Control (QC) Check for SO2, NO2, O3, and CO. (a) A one-point QC check must be performed at least once every 2 weeks on each automated monitor used to measure SO2, NO2, O3 and CO. With the advent of automated calibration systems, more frequent checking is strongly encouraged and may be required by the PSD reviewing authority. See Reference 10 of this appendix for guidance on the review procedure. The QC check is made by challenging the monitor with a QC check gas of known concentration (effective concentration for open path monitors) between the prescribed range of 0.005 and 0.08 parts per million (ppm) for SO2, NO2, and O3, and between the prescribed range of 0.5 and 5 ppm for CO monitors. The QC check gas concentration selected within the prescribed range should be related to monitoring objectives for the monitor. If monitoring for trace level monitoring, the QC check concentration should be selected to represent the mean or median concentrations at the site. If the mean or median concentrations at trace gas sites are below the MDL of the instrument the agency can select the lowest concentration in the prescribed range that can be practically achieved. If the mean or median concentrations at trace gas sites are above the prescribed range the agency can select the highest concentration in the prescribed range. The PSD monitoring organization will consult with the PSD reviewing authority on the most appropriate one-point QC concentration based on the objectives of the monitoring activity. An additional QC check point is encouraged for those organizations that may have occasional high values or would like to confirm the monitors' linearity at the higher end of the operational range or around NAAQS concentrations. If monitoring for NAAQS decisions the QC concentration can be selected at a higher concentration within the prescribed range but should also consider precision points around mean or median concentrations.
(b) Point analyzers must operate in their normal sampling mode during the QC check and the test atmosphere must pass through all filters, scrubbers, conditioners and other components used during normal ambient sampling and as much of the ambient air inlet system as is practicable. The QC check must be conducted before any calibration or adjustment to the monitor.
(c) Open-path monitors are tested by inserting a test cell containing a QC check gas concentration into the optical measurement beam of the instrument. If possible, the normally used transmitter, receiver, and as appropriate, reflecting devices should be used during the test and the normal monitoring configuration of the instrument should be altered as little as possible to accommodate the test cell for the test. However, if permitted by the associated operation or instruction manual, an alternate local light source or an alternate optical path that does not include the normal atmospheric monitoring path may be used. The actual concentration of the QC check gas in the test cell must be selected to produce an effective concentration in the range specified earlier in this section. Generally, the QC test concentration measurement will be the sum of the atmospheric pollutant concentration and the QC test concentration. As such, the result must be corrected to remove the atmospheric concentration contribution. The corrected concentration is obtained by subtracting the average of the atmospheric concentrations measured by the open path instrument under test immediately before and immediately after the QC test from the QC check gas concentration measurement. If the difference between these before and after measurements is greater than 20 percent of the effective concentration of the test gas, discard the test result and repeat the test. If possible, open path monitors should be tested during periods when the atmospheric pollutant concentrations are relatively low and steady.
(d) Report the audit concentration of the QC gas and the corresponding measured concentration indicated by the monitor. The percent differences between these concentrations are used to assess the precision and bias of the monitoring data as described in sections 4.1.2 (precision) and 4.1.3 (bias) of this appendix.
3.1.2 Quarterly performance evaluation for SO2, NO2, O3, or CO. Evaluate each primary monitor each monitoring quarter (or 90 day frequency) during which monitors are operated or a least once (if operated for less than one quarter). The quarterly performance evaluation (quarterly PE) must be performed by a qualified individual, group, or organization that is not part of the organization directly performing and accountable for the work being assessed. The person or entity performing the quarterly PE must not be involved with the generation of the routinely-collected ambient air monitoring data. A PSD monitoring organization can conduct the quarterly PE itself if it can meet this definition and has a management structure that, at a minimum, will allow for the separation of its routine sampling personnel from its auditing personnel by two levels of management. The quarterly PE also requires a set of equipment and standards independent from those used for routine calibrations or zero, span or precision checks.
3.1.2.1 The evaluation is made by challenging the monitor with audit gas standards of known concentration from at least three audit levels. One point must be within two to three times the method detection limit of the instruments within the PQAOs network, the second point will be less than or equal to the 99th percentile of the data at the site or the network of sites in the PQAO or the next highest audit concentration level. The third point can be around the primary NAAQS or the highest 3-year concentration at the site or the network of sites in the PQAO. An additional 4th level is encouraged for those PSD organizations that would like to confirm the monitor's linearity at the higher end of the operational range. In rare circumstances, there may be sites measuring concentrations above audit level 10. These sites should be identified to the PSD reviewing authority.
| Audit level | Concentration range, ppm | |||
|---|---|---|---|---|
| O3 | SO2 | NO2 | CO | |
| 1 | 0.004-0.0059 | 0.0003-0.0029 | 0.0003-0.0029 | 0.020-0.059 |
| 2 | 0.006-0.019 | 0.0030-0.0049 | 0.0030-0.0049 | 0.060-0.199 |
| 3 | 0.020-0.039 | 0.0050-0.0079 | 0.0050-0.0079 | 0.200-0.899 |
| 4 | 0.040-0.069 | 0.0080-0.0199 | 0.0080-0.0199 | 0.900-2.999 |
| 5 | 0.070-0.089 | 0.0200-0.0499 | 0.0200-0.0499 | 3.000-7.999 |
| 6 | 0.090-0.119 | 0.0500-0.0999 | 0.0500-0.0999 | 8.000-15.999 |
| 7 | 0.120-0.139 | 0.1000-0.1499 | 0.1000-0.2999 | 16.000-30.999 |
| 8 | 0.140-0.169 | 0.1500-0.2599 | 0.3000-0.4999 | 31.000-39.999 |
| 9 | 0.170-0.189 | 0.2600-0.7999 | 0.5000-0.7999 | 40.000-49.999 |
| 10 | 0.190-0.259 | 0.8000-1.000 | 0.8000-1.000 | 50.000-60.000 |
3.1.2.2 The NO2 audit techniques may vary depending on the ambient monitoring method. For chemiluminescence-type NO2 analyzers, gas phase titration (GPT) techniques should be based on the EPA guidance documents and monitoring agency experience. The NO2 gas standards may be more appropriate than GPT for direct NO2 methods that do not employ converters. Care should be taken to ensure the stability of such gas standards prior to use.
3.1.2.3 The standards from which audit gas test concentrations are obtained must meet the specifications of section 2.6.1 of this appendix.
3.1.2.4 For point analyzers, the evaluation shall be carried out by allowing the monitor to analyze the audit gas test atmosphere in its normal sampling mode such that the test atmosphere passes through all filters, scrubbers, conditioners, and other sample inlet components used during normal ambient sampling and as much of the ambient air inlet system as is practicable.
3.1.2.5 Open-path monitors are evaluated by inserting a test cell containing the various audit gas concentrations into the optical measurement beam of the instrument. If possible, the normally used transmitter, receiver, and, as appropriate, reflecting devices should be used during the evaluation, and the normal monitoring configuration of the instrument should be modified as little as possible to accommodate the test cell for the evaluation. However, if permitted by the associated operation or instruction manual, an alternate local light source or an alternate optical path that does not include the normal atmospheric monitoring path may be used. The actual concentrations of the audit gas in the test cell must be selected to produce effective concentrations in the evaluation level ranges specified in this section of this appendix. Generally, each evaluation concentration measurement result will be the sum of the atmospheric pollutant concentration and the evaluation test concentration. As such, the result must be corrected to remove the atmospheric concentration contribution. The corrected concentration is obtained by subtracting the average of the atmospheric concentrations measured by the open-path instrument under test immediately before and immediately after the evaluation test (or preferably before and after each evaluation concentration level) from the evaluation concentration measurement. If the difference between the before and after measurements is greater than 20 percent of the effective concentration of the test gas standard, discard the test result for that concentration level and repeat the test for that level. If possible, open-path monitors should be evaluated during periods when the atmospheric pollutant concentrations are relatively low and steady. Also, if the open-path instrument is not installed in a permanent manner, the monitoring path length must be reverified to be within ±3 percent to validate the evaluation, since the monitoring path length is critical to the determination of the effective concentration.
3.1.2.6 Report both the evaluation concentrations (effective concentrations for open-path monitors) of the audit gases and the corresponding measured concentration (corrected concentrations, if applicable, for open-path monitors) indicated or produced by the monitor being tested. The percent differences between these concentrations are used to assess the quality of the monitoring data as described in section 4.1.1 of this appendix.
3.1.3 National Performance Audit Program (NPAP). As stated in sections 1.1 and 2.4, PSD monitoring networks may be subject to the NPEP, which includes the NPAP. The NPAP is a performance evaluation which is a type of audit where quantitative data are collected independently in order to evaluate the proficiency of an analyst, monitoring instrument and laboratory. Due to the implementation approach used in this program, NPAP provides for a national independent assessment of performance with a consistent level of data quality. The NPAP should not be confused with the quarterly PE program described in section 3.1.2. The PSD organizations shall consult with the PSD reviewing authority or the EPA regarding whether the implementation of NPAP is required and the implementation options available. Details of the EPA NPAP can be found in reference 11 of this appendix. The program requirements include:
3.1.3.1 Performing audits on 100 percent of monitors and sites each year including monitors and sites that may be operated for less than 1 year. The PSD reviewing authority has the authority to require more frequent audits at sites they consider to be high priority.
3.1.3.2 Developing a delivery system that will allow for the audit concentration gasses to be introduced at the probe inlet where logistically feasible.
3.1.3.3 Using audit gases that are verified against the National Institute for Standards and Technology (NIST) standard reference methods or special review procedures and validated annually for CO, SO2 and NO2, and at the beginning of each quarter of audits for O3.
3.1.3.4 The PSD PQAO may elect to self-implement NPAP. In these cases, the PSD reviewing authority will work with those PSD PQAOs to establish training and other technical requirements to establish comparability to federally implemented programs. In addition to meeting the requirements in sections 3.1.1.3 through 3.1.3.3, the PSD PQAO must:
(a) Ensure that the PSD audit system is equivalent to the EPA NPAP audit system and is an entirely separate set of equipment and standards from the equipment used for quarterly performance evaluations. If this system does not generate and analyze the audit concentrations, as the EPA NPAP system does, its equivalence to the EPA NPAP system must be proven to be as accurate under a full range of appropriate and varying conditions as described in section 3.1.3.6.
(b) Perform a whole system check by having the PSD audit system tested at an independent and qualified EPA lab, or equivalent.
(c) Evaluate the system with the EPA NPAP program through collocated auditing at an acceptable number of sites each year (at least one for a PSD network of five or less sites; at least two for a network with more than five sites).
(d) Incorporate the NPAP into the PSD PQAO's QAPP.
(e) Be subject to review by independent, EPA-trained personnel.
(f) Participate in initial and update training/certification sessions.
3.2 PM2.5.
3.2.1 Flow Rate Verification for PM2.5. A one-point flow rate verification check must be performed at least once every month (each verification minimally separated by 14 days) on each monitor used to measure PM2.5. The verification is made by checking the operational flow rate of the monitor. If the verification is made in conjunction with a flow rate adjustment, it must be made prior to such flow rate adjustment. For the standard procedure, use a flow rate transfer standard certified in accordance with section 2.6 of this appendix to check the monitor's normal flow rate. Care should be used in selecting and using the flow rate measurement device such that it does not alter the normal operating flow rate of the monitor. Flow rate verification results are to be reported to the PSD reviewing authority quarterly as described in section 5.1. Reporting these results to AQS is encouraged. The percent differences between the audit and measured flow rates are used to assess the bias of the monitoring data as described in section 4.2.2 of this appendix (using flow rates in lieu of concentrations).
3.2.2 Semi-Annual Flow Rate Audit for PM2.5. Every 6 months, audit the flow rate of the PM2.5 particulate monitors. For short-term monitoring operations (those less than 1 year), the flow rate audits must occur at start up, at the midpoint, and near the completion of the monitoring project. The audit must be conducted by a trained technician other than the routine site operator. The audit is made by measuring the monitor's normal operating flow rate using a flow rate transfer standard certified in accordance with section 2.6 of this appendix. The flow rate standard used for auditing must not be the same flow rate standard used for verifications or to calibrate the monitor. However, both the calibration standard and the audit standard may be referenced to the same primary flow rate or volume standard. Care must be taken in auditing the flow rate to be certain that the flow measurement device does not alter the normal operating flow rate of the monitor. Report the audit flow rate of the transfer standard and the corresponding flow rate measured by the monitor. The percent differences between these flow rates are used to evaluate monitor performance.
3.2.3 Collocated Sampling Procedures for PM2.5. A PSD PQAO must have at least one collocated monitor for each PSD monitoring network.
3.2.3.1 For each pair of collocated monitors, designate one sampler as the primary monitor whose concentrations will be used to report air quality for the site, and designate the other as the QC monitor. There can be only one primary monitor at a monitoring site for a given time period.
(a) If the primary monitor is a FRM, then the quality control monitor must be a FRM of the same method designation.
(b) If the primary monitor is a FEM, then the quality control monitor must be a FRM unless the PSD PQAO submits a waiver for this requirement, provides a specific reason why a FRM cannot be implemented, and the waiver is approved by the PSD reviewing authority. If the waiver is approved, then the quality control monitor must be the same method designation as the primary FEM monitor.
3.2.3.2 In addition, the collocated monitors should be deployed according to the following protocol:
(a) The collocated quality control monitor(s) should be deployed at sites with the highest predicted daily PM2.5 concentrations in the network. If the highest PM2.5 concentration site is impractical for collocation purposes, alternative sites approved by the PSD reviewing authority may be selected. If additional collocated sites are necessary, the PSD PQAO and the PSD reviewing authority should determine the appropriate location(s) based on data needs.
(b) The two collocated monitors must be within 4 meters of each other and at least 2 meters apart for flow rates greater than 200 liters/min or at least 1 meter apart for samplers having flow rates less than 200 liters/min to preclude airflow interference. A waiver allowing up to 10 meters horizontal distance and up to 3 meters vertical distance (inlet to inlet) between a primary and collocated quality control monitor may be approved by the PSD reviewing authority for sites at a neighborhood or larger scale of representation. This waiver may be approved during the QAPP review and approval process. Sampling and analytical methodologies must be the consistently implemented for both collocated samplers and for all other samplers in the network.
(c) Sample the collocated quality control monitor on a 6-day schedule for sites not requiring daily monitoring and on a 3-day schedule for any site requiring daily monitoring. Report the measurements from both primary and collocated quality control monitors at each collocated sampling site. The calculations for evaluating precision between the two collocated monitors are described in section 4.2.1 of this appendix.
3.2.4 PM2.5 Performance Evaluation Program (PEP) Procedures. As stated in sections 1.1 and 2.4 of this appendix, PSD monitoring networks may be subject to the NPEP, which includes the PM2.5 PEP. The PSD monitoring organizations shall consult with the PSD reviewing authority or the EPA regarding whether the implementation of PM2.5 PEP is required and the implementation options available for the PM2.5 PEP. For PSD PQAOs with less than or equal to five monitoring sites, five valid performance evaluation audits must be collected and reported each year. For PSD PQAOs with greater than five monitoring sites, eight valid performance evaluation audits must be collected and reported each year. Additionally, within the five or eight required audits, each type of method designation (FRM/FEM designation) used as a primary monitor in the PSD network shall be audited. For a PE to be valid, both the primary monitor and PEP audit measurements must meet quality control requirements and be above 3 µg/m3 or a predefined lower concentration level determined by a systematic planning process and approved by the PSD reviewing authority. Due to the relatively short-term nature of most PSD monitoring, the likelihood of measuring low concentrations in many areas attaining the PM2.5 standard and the time required to weigh filters collected in PEs, a PSD monitoring organization's QAPP may contain a provision to waive the 3 µg/m3 threshold for validity of PEs conducted in the last quarter of monitoring, subject to approval by the PSD reviewing authority.
3.3 PM10.
3.3.1 Flow Rate Verification for PM10. A one-point flow rate verification check must be performed at least once every month (each verification minimally separated by 14 days) on each monitor used to measure PM10. The verification is made by checking the operational flow rate of the monitor. If the verification is made in conjunction with a flow rate adjustment, it must be made prior to such flow rate adjustment. For the standard procedure, use a flow rate transfer standard certified in accordance with section 2.6 of this appendix to check the monitor's normal flow rate. Care should be taken in selecting and using the flow rate measurement device such that it does not alter the normal operating flow rate of the monitor. The percent differences between the audit and measured flow rates are used to assess the bias of the monitoring data as described in section 4.2.2 of this appendix (using flow rates in lieu of concentrations).
3.3.2 Semi-Annual Flow Rate Audit for PM10. Every 6 months, audit the flow rate of the PM10 particulate monitors. For short-term monitoring operations (those less than 1 year), the flow rate audits must occur at start up, at the midpoint, and near the completion of the monitoring project. Where possible, the EPA strongly encourages more frequent auditing. The audit must be conducted by a trained technician other than the routine site operator. The audit is made by measuring the monitor's normal operating flow rate using a flow rate transfer standard certified in accordance with section 2.6 of this appendix. The flow rate standard used for auditing must not be the same flow rate standard used for verifications or to calibrate the monitor. However, both the calibration standard and the audit standard may be referenced to the same primary flow rate or volume standard. Care must be taken in auditing the flow rate to be certain that the flow measurement device does not alter the normal operating flow rate of the monitor. Report the audit flow rate of the transfer standard and the corresponding flow rate measured by the monitor. The percent differences between these flow rates are used to evaluate monitor performance
3.3.3 Collocated Sampling Procedures for Manual PM10. A PSD PQAO must have at least one collocated monitor for each PSD monitoring network.
3.3.3.1 For each pair of collocated monitors, designate one sampler as the primary monitor whose concentrations will be used to report air quality for the site, and designate the other as the quality control monitor.
3.3.3.2 In addition, the collocated monitors should be deployed according to the following protocol:
(a) The collocated quality control monitor(s) should be deployed at sites with the highest predicted daily PM10 concentrations in the network. If the highest PM10 concentration site is impractical for collocation purposes, alternative sites approved by the PSD reviewing authority may be selected.
(b) The two collocated monitors must be within 4 meters of each other and at least 2 meters apart for flow rates greater than 200 liters/min or at least 1 meter apart for samplers having flow rates less than 200 liters/min to preclude airflow interference. A waiver allowing up to 10 meters horizontal distance and up to 3 meters vertical distance (inlet to inlet) between a primary and collocated sampler may be approved by the PSD reviewing authority for sites at a neighborhood or larger scale of representation. This waiver may be approved during the QAPP review and approval process. Sampling and analytical methodologies must be the consistently implemented for both collocated samplers and for all other samplers in the network.
(c) Sample the collocated quality control monitor on a 6-day schedule or 3-day schedule for any site requiring daily monitoring. Report the measurements from both primary and collocated quality control monitors at each collocated sampling site. The calculations for evaluating precision between the two collocated monitors are described in section 4.2.1 of this appendix.
(d) In determining the number of collocated sites required for PM10, PSD monitoring networks for Pb-PM10 should be treated independently from networks for particulate matter (PM), even though the separate networks may share one or more common samplers. However, a single quality control monitor that meets the collocation requirements for Pb-PM10 and PM10 may serve as a collocated quality control monitor for both networks. Extreme care must be taken if using the filter from a quality control monitor for both PM10 and Pb analysis. PM10 filter weighing should occur prior to any Pb analysis.
3.4 Pb.
3.4.1 Flow Rate Verification for Pb. A one-point flow rate verification check must be performed at least once every month (each verification minimally separated by 14 days) on each monitor used to measure Pb. The verification is made by checking the operational flow rate of the monitor. If the verification is made in conjunction with a flow rate adjustment, it must be made prior to such flow rate adjustment. Use a flow rate transfer standard certified in accordance with section 2.6 of this appendix to check the monitor's normal flow rate. Care should be taken in selecting and using the flow rate measurement device such that it does not alter the normal operating flow rate of the monitor. The percent differences between the audit and measured flow rates are used to assess the bias of the monitoring data as described in section 4.2.2 of this appendix (using flow rates in lieu of concentrations).
3.4.2 Semi-Annual Flow Rate Audit for Pb. Every 6 months, audit the flow rate of the Pb particulate monitors. For short-term monitoring operations (those less than 1 year), the flow rate audits must occur at start up, at the midpoint, and near the completion of the monitoring project. Where possible, the EPA strongly encourages more frequent auditing. The audit must be conducted by a trained technician other than the routine site operator. The audit is made by measuring the monitor's normal operating flow rate using a flow rate transfer standard certified in accordance with section 2.6 of this appendix. The flow rate standard used for auditing must not be the same flow rate standard used to in verifications or to calibrate the monitor. However, both the calibration standard and the audit standard may be referenced to the same primary flow rate or volume standard. Great care must be taken in auditing the flow rate to be certain that the flow measurement device does not alter the normal operating flow rate of the monitor. Report the audit flow rate of the transfer standard and the corresponding flow rate measured by the monitor. The percent differences between these flow rates are used to evaluate monitor performance.
3.4.3 Collocated Sampling for Pb. A PSD PQAO must have at least one collocated monitor for each PSD monitoring network.
3.4.3.1 For each pair of collocated monitors, designate one sampler as the primary monitor whose concentrations will be used to report air quality for the site, and designate the other as the quality control monitor.
3.4.3.2 In addition, the collocated monitors should be deployed according to the following protocol:
(a) The collocated quality control monitor(s) should be deployed at sites with the highest predicted daily Pb concentrations in the network. If the highest Pb concentration site is impractical for collocation purposes, alternative sites approved by the PSD reviewing authority may be selected.
(b) The two collocated monitors must be within 4 meters of each other and at least 2 meters apart for flow rates greater than 200 liters/min or at least 1 meter apart for samplers having flow rates less than 200 liters/min to preclude airflow interference. A waiver allowing up to 10 meters horizontal distance and up to 3 meters vertical distance (inlet to inlet) between a primary and collocated sampler may be approved by the PSD reviewing authority for sites at a neighborhood or larger scale of representation. This waiver may be approved during the QAPP review and approval process. Sampling and analytical methodologies must be the consistently implemented for both collocated samplers and all other samplers in the network.
(c) Sample the collocated quality control monitor on a 6-day schedule if daily monitoring is not required or 3-day schedule for any site requiring daily monitoring. Report the measurements from both primary and collocated quality control monitors at each collocated sampling site. The calculations for evaluating precision between the two collocated monitors are described in section 4.2.1 of this appendix.
(d) In determining the number of collocated sites required for Pb-PM10, PSD monitoring networks for PM10 should be treated independently from networks for Pb-PM10, even though the separate networks may share one or more common samplers. However, a single quality control monitor that meets the collocation requirements for Pb-PM10 and PM10 may serve as a collocated quality control monitor for both networks. Extreme care must be taken if using a using the filter from a quality control monitor for both PM10 and Pb analysis. The PM10 filter weighing should occur prior to any Pb analysis.
3.4.4 Pb Analysis Audits. Each calendar quarter, audit the Pb reference or equivalent method analytical procedure using filters containing a known quantity of Pb. These audit filters are prepared by depositing a Pb standard on unexposed filters and allowing them to dry thoroughly. The audit samples must be prepared using batches of reagents different from those used to calibrate the Pb analytical equipment being audited. Prepare audit samples in the following concentration ranges:
| Range | Equivalent ambient
Pb concentration, µg/m3 |
|---|---|
| 1 | 30-100% of Pb NAAQS. |
| 2 | 200-300% of Pb NAAQS. |
(a) Audit samples must be extracted using the same extraction procedure used for exposed filters.
(b) Analyze three audit samples in each of the two ranges each quarter samples are analyzed. The audit sample analyses shall be distributed as much as possible over the entire calendar quarter.
(c) Report the audit concentrations (in µg Pb/filter or strip) and the corresponding measured concentrations (in µg Pb/filter or strip) using AQS unit code 077 (if reporting to AQS). The percent differences between the concentrations are used to calculate analytical accuracy as described in section 4.2.5 of this appendix.
3.4.5 Pb Performance Evaluation Program (PEP) Procedures. As stated in sections 1.1 and 2.4, PSD monitoring networks may be subject to the NPEP, which includes the Pb PEP. The PSD monitoring organizations shall consult with the PSD reviewing authority or the EPA regarding whether the implementation of Pb-PEP is required and the implementation options available for the Pb-PEP. The PEP is an independent assessment used to estimate total measurement system bias. Each year, one PE audit must be performed at one Pb site in each PSD PQAO network that has less than or equal to five sites and two audits for PSD PQAO networks with greater than five sites. In addition, each year, four collocated samples from PSD PQAO networks with less than or equal to five sites and six collocated samples from PSD PQAO networks with greater than five sites must be sent to an independent laboratory for analysis. The calculations for evaluating bias between the primary monitor and the PE monitor for Pb are described in section 4.2.4 of this appendix.
4. Calculations for Data Quality Assessments
(a) Calculations of measurement uncertainty are carried out by PSD PQAO according to the following procedures. The PSD PQAOs should report the data for all appropriate measurement quality checks as specified in this appendix even though they may elect to perform some or all of the calculations in this section on their own.
(b) At low concentrations, agreement between the measurements of collocated samplers, expressed as relative percent difference or percent difference, may be relatively poor. For this reason, collocated measurement pairs will be selected for use in the precision and bias calculations only when both measurements are equal to or above the following limits:
(1) Pb: 0.002 µg/m3 (Methods approved after 3/04/2010, with exception of manual equivalent method EQLA-0813-803).
(2) Pb: 0.02 µg/m3 (Methods approved before 3/04/2010, and manual equivalent method EQLA-0813-803).
(3) PM10 (Hi-Vol): 15 µg/m3.
(4) PM10 (Lo-Vol): 3 µg/m3.
(5) PM2.5: 3 µg/m3.
(c) The PM2.5 3 µg/m3 limit for the PM2.5−PEP may be superseded by mutual agreement between the PSD PQAO and the PSD reviewing authority as specified in section 3.2.4 of the appendix and detailed in the approved QAPP.
4.1 Statistics for the Assessment of QC Checks for SO2, NO2, O3 and CO.
4.1.1 Percent Difference. Many of the measurement quality checks start with a comparison of an audit concentration or value (flow-rate) to the concentration/value measured by the monitor and use percent difference as the comparison statistic as described in equation 1 of this section. For each single point check, calculate the percent difference, di, as follows:
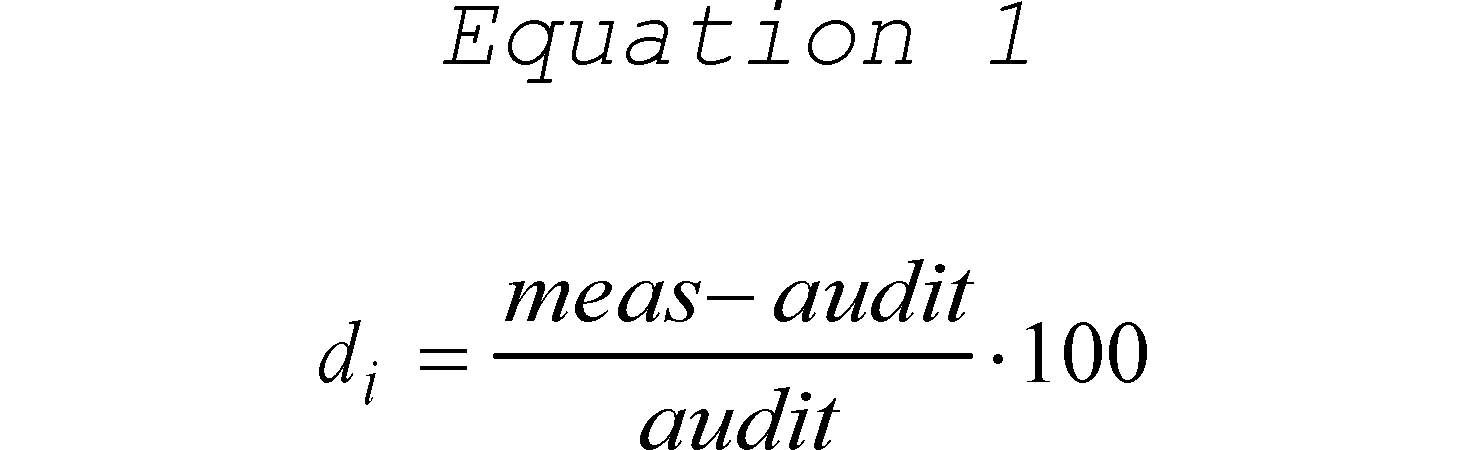
where meas is the concentration indicated by the PQAO's instrument and audit is the audit concentration of the standard used in the QC check being measured.
4.1.2 Precision Estimate. The precision estimate is used to assess the one-point QC checks for SO2, NO2, O3, or CO described in section 3.1.1 of this appendix. The precision estimator is the coefficient of variation upper bound and is calculated using equation 2 of this section:
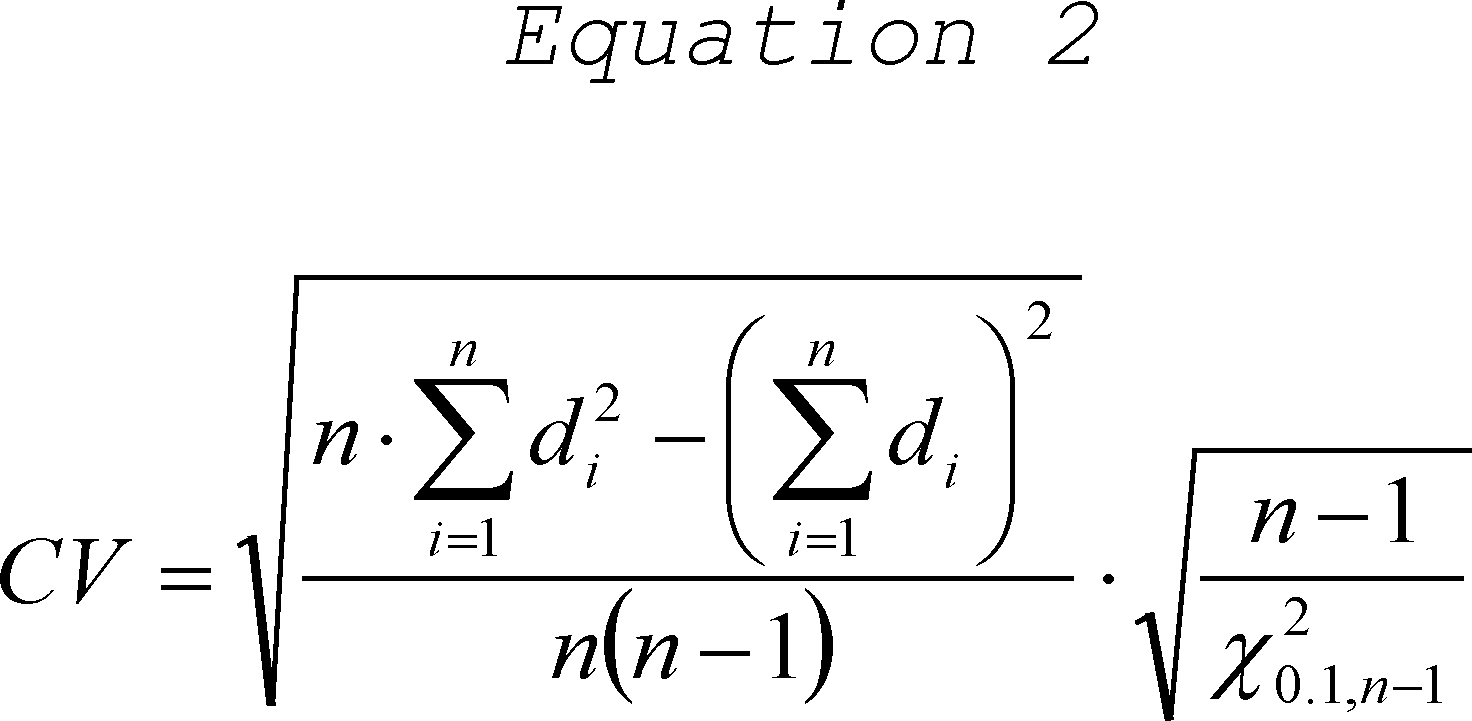
where n is the number of single point checks being aggregated; X20.1,n-1 is the 10th percentile of a chi-squared distribution with n-1 degrees of freedom.
4.1.3 Bias Estimate. The bias estimate is calculated using the one-point QC checks for SO2, NO2, O3, or CO described in section 3.1.1 of this appendix. The bias estimator is an upper bound on the mean absolute value of the percent differences as described in equation 3 of this section:

where n is the number of single point checks being aggregated; t0.95,n-1 is the 95th quantile of a t-distribution with n-1 degrees of freedom; the quantity AB is the mean of the absolute values of the di′s and is calculated using equation 4 of this section:
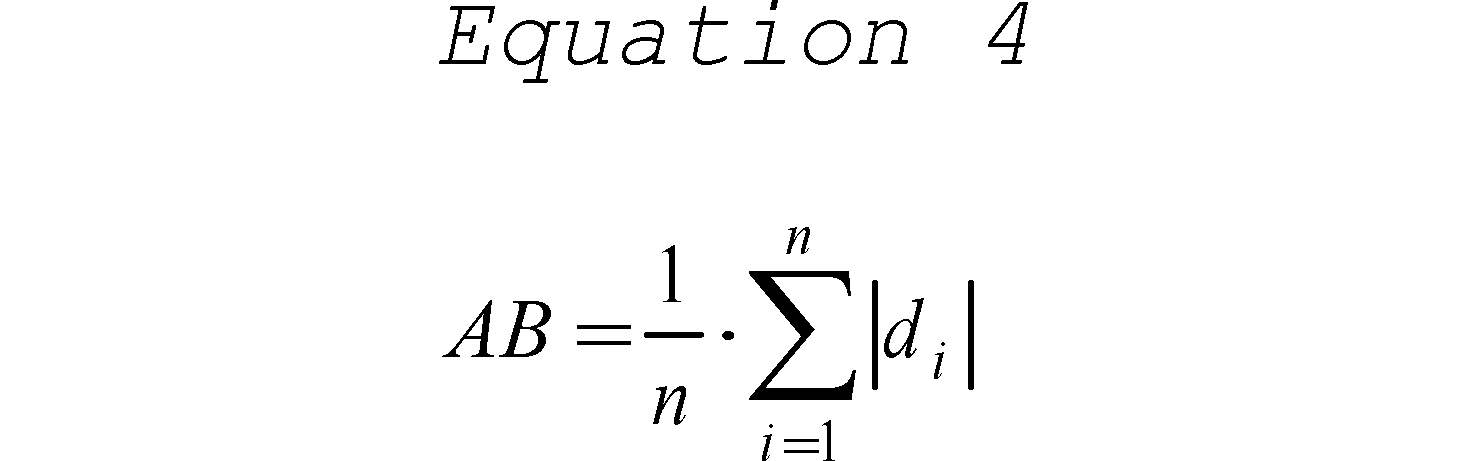
and the quantity AS is the standard deviation of the absolute value of the di′s and is calculated using equation 5 of this section:
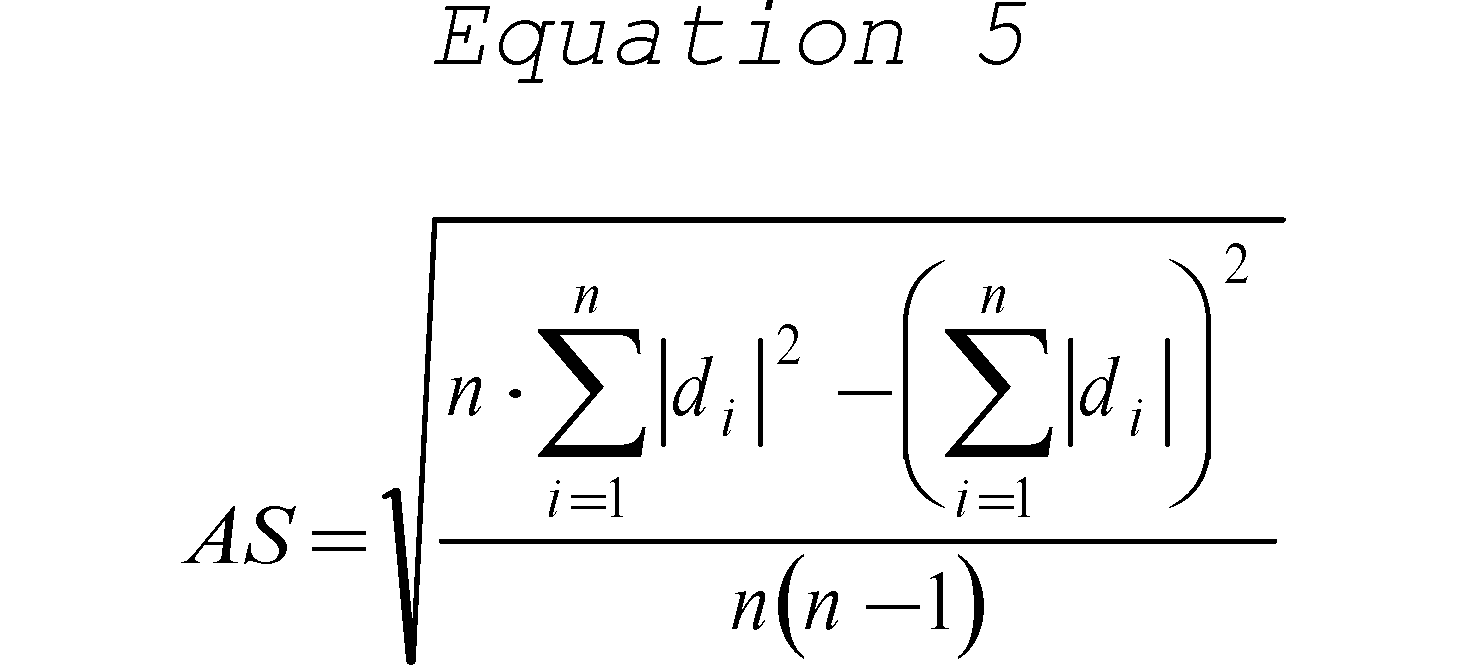
4.1.3.1 Assigning a sign (positive/negative) to the bias estimate. Since the bias statistic as calculated in equation 3 of this appendix uses absolute values, it does not have a tendency (negative or positive bias) associated with it. A sign will be designated by rank ordering the percent differences of the QC check samples from a given site for a particular assessment interval.
4.1.3.2 Calculate the 25th and 75th percentiles of the percent differences for each site. The absolute bias upper bound should be flagged as positive if both percentiles are positive and negative if both percentiles are negative. The absolute bias upper bound would not be flagged if the 25th and 75th percentiles are of different signs.
4.2 Statistics for the Assessment of PM10, PM2.5, and Pb.
4.2.1 Collocated Quality Control Sampler Precision Estimate for PM10, PM2.5 and Pb. Precision is estimated via duplicate measurements from collocated samplers. It is recommended that the precision be aggregated at the PQAO level quarterly, annually, and at the 3-year level. The data pair would only be considered valid if both concentrations are greater than or equal to the minimum values specified in section 4(c) of this appendix. For each collocated data pair, calculate the relative percent difference, di, using equation 6 of this appendix:
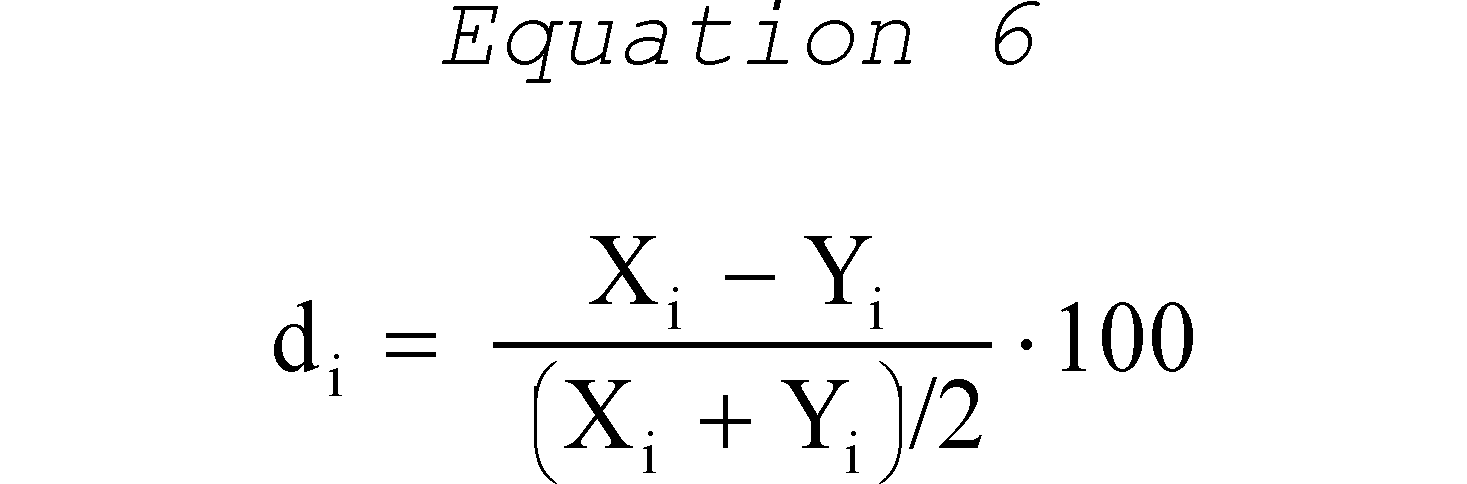
where Xi is the concentration from the primary sampler and Yi is the concentration value from the audit sampler. The coefficient of variation upper bound is calculated using equation 7 of this appendix:

where n is the number of valid data pairs being aggregated, and X20.1,n-1 is the 10th percentile of a chi-squared distribution with n-1 degrees of freedom. The factor of 2 in the denominator adjusts for the fact that each di is calculated from two values with error.
4.2.2 One-Point Flow Rate Verification Bias Estimate for PM10, PM2.5 and Pb. For each one-point flow rate verification, calculate the percent difference in volume using equation 1 of this appendix where meas is the value indicated by the sampler's volume measurement and audit is the actual volume indicated by the auditing flow meter. The absolute volume bias upper bound is then calculated using equation 3, where n is the number of flow rate audits being aggregated; t0.95,n-1 is the 95th quantile of a t-distribution with n-1 degrees of freedom, the quantity AB is the mean of the absolute values of the di′s and is calculated using equation 4 of this appendix, and the quantity AS in equation 3 of this appendix is the standard deviation of the absolute values if the di′s and is calculated using equation 5 of this appendix.
4.2.3 Semi-Annual Flow Rate Audit Bias Estimate for PM10, PM2.5 and Pb. Use the same procedure described in section 4.2.2 for the evaluation of flow rate audits.
4.2.4 Performance Evaluation Programs Bias Estimate for Pb. The Pb bias estimate is calculated using the paired routine and the PEP monitor as described in section 3.4.5. Use the same procedures as described in section 4.1.3 of this appendix.
4.2.5 Performance Evaluation Programs Bias Estimate for PM2.5. The bias estimate is calculated using the PEP audits described in section 4.1.3 of this appendix. The bias estimator is based on the mean percent differences (Equation 1). The mean percent difference, D, is calculated by Equation 8 below.
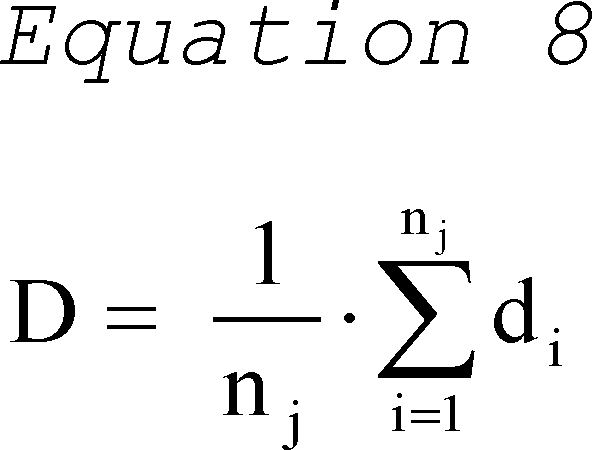
where nj is the number of pairs and d1,d2,...dnj are the biases for each pair to be averaged.
4.2.6 Pb Analysis Audit Bias Estimate. The bias estimate is calculated using the analysis audit data described in section 3.4.4. Use the same bias estimate procedure as described in section 4.1.3 of this appendix.
5. Reporting Requirements
5.1. Quarterly Reports. For each quarter, each PSD PQAO shall report to the PSD reviewing authority (and AQS if required by the PSD reviewing authority) the results of all valid measurement quality checks it has carried out during the quarter. The quarterly reports must be submitted consistent with the data reporting requirements specified for air quality data as set forth in 40 CFR 58.16 and pertain to PSD monitoring.
6. References
(1) American National Standard—Specifications and Guidelines for Quality Systems for Environmental Data Collection and Environmental Technology Programs. ANSI/ASQC E4-2014. February 2014. Available from American Society for Quality Control, 611 East Wisconsin Avenue, Milwaukee, WI 53202.
(2) EPA Requirements for Quality Management Plans. EPA QA/R-2. EPA/240/B-01/002. March 2001, Reissue May 2006. Office of Environmental Information, Washington, DC 20460. http://www.epa.gov/quality/agency-wide-quality-system-documents.
(3) EPA Requirements for Quality Assurance Project Plans for Environmental Data Operations. EPA QA/R-5. EPA/240/B-01/003. March 2001, Reissue May 2006. Office of Environmental Information, Washington, DC 20460. http://www.epa.gov/quality/agency-wide-quality-system-documents.
(4) EPA Traceability Protocol for Assay and Certification of Gaseous Calibration Standards. EPA-600/R-12/531. May, 2012. Available from U.S. Environmental Protection Agency, National Risk Management Research Laboratory, Research Triangle Park NC 27711. http://cfpub.epa.gov/si/si_public_record_report.cfm?dirEntryId=245292.
(5) Guidance for the Data Quality Objectives Process. EPA QA/G-4. EPA/240/B-06/001. February, 2006. Office of Environmental Information, Washington, DC 20460. http://www.epa.gov/quality/agency-wide-quality-system-documents.
(6) List of Designated Reference and Equivalent Methods. Available from U.S. Environmental Protection Agency, National Exposure Research Laboratory, Human Exposure and Atmospheric Sciences Division, MD-D205-03, Research Triangle Park, NC 27711. http://www3.epa.gov/ttn/amtic/criteria.html.
(7) Transfer Standards for the Calibration of Ambient Air Monitoring Analyzers for Ozone. EPA-454/B-13-004 U.S. Environmental Protection Agency, Research Triangle Park, NC 27711, October, 2013. http://www3.epa.gov/ttn/amtic/qapollutant.html.
(8) Paur, R.J. and F.F. McElroy. Technical Assistance Document for the Calibration of Ambient Ozone Monitors. EPA-600/4-79-057. U.S. Environmental Protection Agency, Research Triangle Park, NC 27711, September, 1979. http://www.epa.gov/ttn/amtic/cpreldoc.html.
(9) Quality Assurance Handbook for Air Pollution Measurement Systems, Volume 1—A Field Guide to Environmental Quality Assurance. EPA-600/R-94/038a. April 1994. Available from U.S. Environmental Protection Agency, ORD Publications Office, Center for Environmental Research Information (CERI), 26 W. Martin Luther King Drive, Cincinnati, OH 45268. http://www3.epa.gov/ttn/amtic/qalist.html.
(10) Quality Assurance Handbook for Air Pollution Measurement Systems, Volume II: Ambient Air Quality Monitoring Program Quality System Development. EPA-454/B-13-003. http://www3.epa.gov/ttn/amtic/qalist.html.
(11) National Performance Evaluation Program Standard Operating Procedures. http://www3.epa.gov/ttn/amtic/npapsop.html.
Table B-1—Minimum Data Assessment Requirements for NAAQS Related Criteria Pollutant PSD Monitors
| Method | Assessment
method |
Coverage | Minimum
frequency |
Parameters
reported |
AQS
Assessment type |
|---|---|---|---|---|---|
| Gaseous Methods (CO , NO 2 , SO 2 , O 3 ) | |||||
| One-Point QC for SO2, NO2, O3, CO | Response check at concentration 0.005-0.08 ppm SO2, NO2, O3, & 0.5 and 5 ppm CO | Each analyzer | Once per 2 weeks | Audit concentration1 and measured concentration2 | One-Point QC. |
| Quarterly performance evaluation for SO2, NO2, O3, CO | See section 3.1.2 of this appendix | Each analyzer | Once per quarter | Audit concentration1 and measured concentration2 for each level | Annual PE. |
| NPAP for SO2, NO2, O3, CO3 | Independent Audit | Each primary monitor | Once per year | Audit concentration1 and measured concentration2 for each level | NPAP. |
| Particulate Methods | |||||
| Collocated sampling PM10, PM2.5, Pb | Collocated samplers | 1 per PSD Network per pollutant | Every 6 days or every 3 days if daily monitoring required | Primary sampler concentration and duplicate sampler concentration4 | No Transaction reported as raw data. |
| Flow rate verification PM10, PM2.5, Pb | Check of sampler flow rate | Each sampler | Once every month | Audit flow rate and measured flow rate indicated by the sampler | Flow Rate Verification. |
| Semi-annual flow rate audit PM10, PM2.5, Pb | Check of sampler flow rate using independent standard | Each sampler | Once every 6 months or beginning, middle and end of monitoring | Audit flow rate and measured flow rate indicated by the sampler | Semi Annual Flow Rate Audit. |
| Pb analysis audits Pb-TSP, Pb-PM10 | Check of analytical system with Pb audit strips/filters | Analytical | Each quarter | Measured value and audit value (ug Pb/filter) using AQS unit code 077 for parameters:
14129—Pb (TSP) LC FRM/FEM 85129—Pb (TSP) LC Non-FRM/FEM. |
Pb Analysis Audits. |
| Performance Evaluation Program PM2.53 | Collocated samplers | (1) 5 valid audits for PQAOs with <= 5 sites.
(2) 8 valid audits for PQAOs with > 5 sites. (3) All samplers in 6 years |
Over all 4 quarters | Primary sampler concentration and performance evaluation sampler concentration | PEP. |
| Performance Evaluation Program Pb3 | Collocated samplers | (1) 1 valid audit and 4 collocated samples for PQAOs, with <=5 sites.
(2) 2 valid audits and 6 collocated samples for PQAOs with >5 sites. |
Over all 4 quarters | Primary sampler concentration and performance evaluation sampler concentration. Primary sampler concentration and duplicate sampler concentration | PEP. |
[81 FR 17290, Mar. 28, 2016]
Appendix C to Part 58—Ambient Air Quality Monitoring Methodology
1.0 Purpose
2.0 SLAMS Ambient Air Monitoring Stations
3.0 NCore Ambient Air Monitoring Stations
4.0 Photochemical Assessment Monitoring Stations (PAMS)
5.0 Particulate Matter Episode Monitoring
6.0 References
1.0 Purpose
This appendix specifies the criteria pollutant monitoring methods (manual methods or automated analyzers) which must be used in SLAMS and NCore stations that are a subset of SLAMS.
2.0 SLAMS Ambient Air Monitoring Network
2.1 Except as otherwise provided in this appendix, a criteria pollutant monitoring method used for making NAAQS decisions at a SLAMS site must be a reference or equivalent method as defined in § 50.1 of this chapter.
2.1.1 Any NO2 FRM or FEM used for making primary NAAQS decisions must be capable of providing hourly averaged concentration data.
2.2 Reserved
2.3 Any manual method or analyzer purchased prior to cancellation of its reference or equivalent method designation under § 53.11 or § 53.16 of this chapter may be used at a SLAMS site following cancellation for a reasonable period of time to be determined by the Administrator.
2.4 Approval of Non-designated Continuous PM2.5 Methods as Approved Regional Methods (ARMs) Operated Within a Network of Sites. A method for PM2.5 that has not been designated as an FRM or FEM as defined in § 50.1 of this chapter may be approved as an ARM for purposes of section 2.1 of this appendix at a particular site or network of sites under the following stipulations.
2.4.1 The candidate ARM must be demonstrated to meet the requirements for PM2.5 Class III equivalent methods as defined in subpart C of part 53 of this chapter. Specifically the requirements for precision, correlation, and additive and multiplicative bias apply. For purposes of this section 2.4, the following requirements shall apply:
2.4.1.1 The candidate ARM shall be tested at the site(s) in which it is intended to be used. For a network of sites operated by one reporting agency or primary quality assurance organization, the testing shall occur at a subset of sites to include one site in each MSA/CSA, up to the first 2 highest population MSA/CSA and at least one rural area or Micropolitan Statistical Area site. If the candidate ARM for a network is already approved for purposes of this section in another agency's network, subsequent testing shall minimally occur at one site in a MSA/CSA and one rural area or Micropolitan Statistical Area. There shall be no requirement for tests at any other sites.
2.4.1.2 For purposes of this section, a full year of testing may begin and end in any season, so long as all seasons are covered.
2.4.1.3 No PM10 samplers shall be required for the test, as determination of the PM2.5/PM10 ratio at the test site shall not be required.
2.4.1.4 The test specification for PM2.5 Class III equivalent method precision defined in subpart C of part 53 of this chapter applies; however, there is no specific requirement that collocated continuous monitors be operated for purposes of generating a statistic for coefficient of variation (CV). To provide an estimate of precision that meets the requirement identified in subpart C of part 53 of this chapter, agencies may cite peer-reviewed published data or data in AQS that can be presented demonstrating the candidate ARM operated will produce data that meets the specification for precision of Class III PM2.5 methods.
2.4.1.5 A minimum of 90 valid sample pairs per site for the year with no less than 20 valid sample pairs per season must be generated for use in demonstrating that additive bias, multiplicative bias and correlation meet the comparability requirements specified in subpart C of part 53 of this chapter. A valid sample pair may be generated with as little as one valid FRM and one valid candidate ARM measurement per day.
2.4.1.6 For purposes of determining bias, FRM data with concentrations less than 3 micrograms per cubic meter (µg/m3) may be excluded. Exclusion of data does not result in failure of sample completeness specified in this section.
2.4.1.7 Data transformations are allowed to be used to demonstrate meeting the comparability requirements specified in subpart C of part 53 of this chapter. Data transformation may be linear or non-linear, but must be applied in the same way to all sites used in the testing.
2.4.2 The monitoring agency wishing to use an ARM must develop and implement appropriate quality assurance procedures for the method. Additionally, the following procedures are required for the method:
2.4.2.1 The ARM must be consistently operated throughout the network. Exceptions to a consistent operation must be approved according to section 2.8 of this appendix;
2.4.2.2 The ARM must be operated on an hourly sampling frequency capable of providing data suitable for aggregation into daily 24-hour average measurements;
2.4.2.3 The ARM must use an inlet and separation device, as needed, that are already approved in either the reference method identified in appendix L to part 50 of this chapter or under part 53 of this chapter as approved for use on a PM2.5 reference or equivalent method. The only exceptions to this requirement are those methods that by their inherent measurement principle may not need an inlet or separation device that segregates the aerosol; and
2.4.2.4 The ARM must be capable of providing for flow audits, unless by its inherent measurement principle, measured flow is not required. These flow audits are to be performed on the frequency identified in appendix A to this part.
2.4.2.5 If data transformations are used, they must be described in the monitoring agencies Quality Assurance Project plan (or addendum to QAPP). The QAPP shall describe how often (e.g., quarterly, yearly) and under what provisions the data transformation will be updated. For example, not meeting the data quality objectives for a site over a season or year may be cause for recalculating a data transformation, but by itself would not be cause for invalidating the data. Data transformations must be applied prospectively, i.e., in real-time or near real-time, to the data output from the PM2.5 continuous method. See reference 7 of this appendix.
2.4.3 The monitoring agency wishing to use the method must develop and implement appropriate procedures for assessing and reporting the precision and accuracy of the method comparable to the procedures set forth in appendix A of this part for designated reference and equivalent methods.
2.4.4 Assessments of data quality shall follow the same frequencies and calculations as required under section 3 of appendix A to this part with the following exceptions:
2.4.4.1 Collocation of ARM with FRM/FEM samplers must be maintained at a minimum of 30 percent of the required SLAMS sites with a minimum of 1 per network;
2.4.4.2 All collocated FRM/FEM samplers must maintain a sample frequency of at least 1 in 6 sample days;
2.4.4.3 Collocated FRM/FEM samplers shall be located at the design value site, with the required FRM/FEM samplers deployed among the largest MSA/CSA in the network, until all required FRM/FEM are deployed; and
2.4.4.4 Data from collocated FRM/FEM are to be substituted for any calendar quarter that an ARM method has incomplete data.
2.4.4.5 Collocation with an ARM under this part for purposes of determining the coefficient of variation of the method shall be conducted at a minimum of 7.5 percent of the sites with a minimum of 1 per network. This is consistent with the requirements in appendix A to this part for one-half of the required collocation of FRM/FEM (15 percent) to be collocated with the same method.
2.4.4.6 Assessments of bias with an independent audit of the total measurement system shall be conducted with the same frequency as an FEM as identified in appendix A to this part.
2.4.5 Request for approval of a candidate ARM, that is not already approved in another agency's network under this section, must meet the general submittal requirements of section 2.7 of this appendix. Requests for approval under this section when an ARM is already approved in another agency's network are to be submitted to the EPA Regional Administrator. Requests for approval under section 2.4 of this appendix must include the following requirements:
2.4.5.1 A clear and unique description of the site(s) at which the candidate ARM will be used and tested, and a description of the nature or character of the site and the particulate matter that is expected to occur there.
2.4.5.2 A detailed description of the method and the nature of the sampler or analyzer upon which it is based.
2.4.5.3 A brief statement of the reason or rationale for requesting the approval.
2.4.5.4 A detailed description of the quality assurance procedures that have been developed and that will be implemented for the method.
2.4.5.5 A detailed description of the procedures for assessing the precision and accuracy of the method that will be implemented for reporting to AQS.
2.4.5.6 Test results from the comparability tests as required in section 2.4.1 through 2.4.1.4 of this appendix.
2.4.5.7 Such further supplemental information as may be necessary or helpful to support the required statements and test results.
2.4.6 Within 120 days after receiving a request for approval of the use of an ARM at a particular site or network of sites under section 2.4 of this appendix, the Administrator will approve or disapprove the method by letter to the person or agency requesting such approval. When appropriate for methods that are already approved in another SLAMS network, the EPA Regional Administrator has approval/disapproval authority. In either instance, additional information may be requested to assist with the decision.
2.5 [Reserved]
2.6 Use of Methods With Higher, Nonconforming Ranges in Certain Geographical Areas.
2.6.1 [Reserved]
2.6.2 An analyzer may be used (indefinitely) on a range which extends to concentrations higher than two times the upper limit specified in table B-1 of part 53 of this chapter if:
2.6.2.1 The analyzer has more than one selectable range and has been designated as a reference or equivalent method on at least one of its ranges, or has been approved for use under section 2.5 (which applies to analyzers purchased before February 18, 1975);
2.6.2.2 The pollutant intended to be measured with the analyzer is likely to occur in concentrations more than two times the upper range limit specified in table B-1 of part 53 of this chapter in the geographical area in which use of the analyzer is proposed; and
2.6.2.3 The Administrator determines that the resolution of the range or ranges for which approval is sought is adequate for its intended use. For purposes of this section (2.6), “resolution” means the ability of the analyzer to detect small changes in concentration.
2.6.3 Requests for approval under section 2.6.2 of this appendix must meet the submittal requirements of section 2.7. Except as provided in section 2.7.3 of this appendix, each request must contain the information specified in section 2.7.2 in addition to the following:
2.6.3.1 The range or ranges proposed to be used;
2.6.3.2 Test data, records, calculations, and test results as specified in section 2.7.2.2 of this appendix for each range proposed to be used;
2.6.3.3 An identification and description of the geographical area in which use of the analyzer is proposed;
2.6.3.4 Data or other information demonstrating that the pollutant intended to be measured with the analyzer is likely to occur in concentrations more than two times the upper range limit specified in table B-1 of part 53 of this chapter in the geographical area in which use of the analyzer is proposed; and
2.6.3.5 Test data or other information demonstrating the resolution of each proposed range that is broader than that permitted by section 2.5 of this appendix.
2.6.4 Any person who has obtained approval of a request under this section (2.6.2) shall assure that the analyzer for which approval was obtained is used only in the geographical area identified in the request and only while operated in the range or ranges specified in the request.
2.7 Requests for Approval; Withdrawal of Approval.
2.7.1 Requests for approval under sections 2.4, 2.6.2, or 2.8 of this appendix must be submitted to: Director, National Exposure Research Laboratory (MD-D205-03), U.S. Environmental Protection Agency, Research Triangle Park, North Carolina 27711. For ARM that are already approved in another agency's network, subsequent requests for approval under section 2.4 are to be submitted to the applicable EPA Regional Administrator.
2.7.2 Except as provided in section 2.7.3 of this appendix, each request must contain:
2.7.2.1 A statement identifying the analyzer (e.g., by serial number) and the method of which the analyzer is representative (e.g., by manufacturer and model number); and
2.7.2.2 Test data, records, calculations, and test results for the analyzer (or the method of which the analyzer is representative) as specified in subpart B, subpart C, or both (as applicable) of part 53 of this chapter.
2.7.3 A request may concern more than one analyzer or geographical area and may incorporate by reference any data or other information known to EPA from one or more of the following:
2.7.3.1 An application for a reference or equivalent method determination submitted to EPA for the method of which the analyzer is representative, or testing conducted by the applicant or by EPA in connection with such an application;
2.7.3.2 Testing of the method of which the analyzer is representative at the initiative of the Administrator under § 53.7 of this chapter; or
2.7.3.3 A previous or concurrent request for approval submitted to EPA under this section (2.7).
2.7.4 To the extent that such incorporation by reference provides data or information required by this section (2.7) or by sections 2.4, 2.5, or 2.6 of this appendix, independent data or duplicative information need not be submitted.
2.7.5 After receiving a request under this section (2.7), the Administrator may request such additional testing or information or conduct such tests as may be necessary in his judgment for a decision on the request.
2.7.6 If the Administrator determines, on the basis of any available information, that any of the determinations or statements on which approval of a request under this section was based are invalid or no longer valid, or that the requirements of section 2.4, 2.5, or 2.6, as applicable, have not been met, he/she may withdraw the approval after affording the person who obtained the approval an opportunity to submit information and arguments opposing such action.
2.8 Modifications of Methods by Users.
2.8.1 Except as otherwise provided in this section, no reference method, equivalent method, or ARM may be used in a SLAMS network if it has been modified in a manner that could significantly alter the performance characteristics of the method without prior approval by the Administrator. For purposes of this section, “alternative method” means an analyzer, the use of which has been approved under section 2.4, 2.5, or 2.6 of this appendix or some combination thereof.
2.8.2 Requests for approval under this section (2.8) must meet the submittal requirements of sections 2.7.1 and 2.7.2.1 of this appendix.
2.8.3 Each request submitted under this section (2.8) must include:
2.8.3.1 A description, in such detail as may be appropriate, of the desired modification;
2.8.3.2 A brief statement of the purpose(s) of the modification, including any reasons for considering it necessary or advantageous;
2.8.3.3 A brief statement of belief concerning the extent to which the modification will or may affect the performance characteristics of the method; and
2.8.3.4 Such further information as may be necessary to explain and support the statements required by sections 2.8.3.2 and 2.8.3.3.
2.8.4 The Administrator will approve or disapprove the modification by letter to the person or agency requesting such approval within 75 days after receiving a request for approval under this section and any further information that the applicant may be asked to provide.
2.8.5 A temporary modification that could alter the performance characteristics of a reference, equivalent, or ARM may be made without prior approval under this section if the method is not functioning or is malfunctioning, provided that parts necessary for repair in accordance with the applicable operation manual cannot be obtained within 45 days. Unless such temporary modification is later approved under section 2.8.4 of this appendix, the temporarily modified method shall be repaired in accordance with the applicable operation manual as quickly as practicable but in no event later than 4 months after the temporary modification was made, unless an extension of time is granted by the Administrator. Unless and until the temporary modification is approved, air quality data obtained with the method as temporarily modified must be clearly identified as such when submitted in accordance with § 58.16 and must be accompanied by a report containing the information specified in section 2.8.3 of this appendix. A request that the Administrator approve a temporary modification may be submitted in accordance with sections 2.8.1 through 2.8.4 of this appendix. In such cases the request will be considered as if a request for prior approval had been made.
2.9 Use of IMPROVE Samplers at a SLAMS Site. “IMPROVE” samplers may be used in SLAMS for monitoring of regional background and regional transport concentrations of fine particulate matter. The IMPROVE samplers were developed for use in the Interagency Monitoring of Protected Visual Environments (IMPROVE) network to characterize all of the major components and many trace constituents of the particulate matter that impair visibility in Federal Class I Areas. Descriptions of the IMPROVE samplers and the data they collect are available in references 4, 5, and 6 of this appendix.
2.10 Use of Pb-PM10 at SLAMS Sites.
2.10.1 The EPA Regional Administrator may approve the use of a Pb-PM10 FRM or Pb-PM10 FEM sampler in lieu of a Pb-TSP sampler as part of the network plan required under part 58.10(a)(4) in the following cases.
2.10.1.1 Pb-PM10 samplers can be approved for use at the non-source-oriented sites required under paragraph 4.5(b) of Appendix D to part 58 if there is no existing monitoring data indicating that the maximum arithmetic 3-month mean Pb concentration (either Pb-TSP or Pb-PM10) at the site was equal to or greater than 0.10 micrograms per cubic meter during the previous 3 years.
2.10.1.2 Pb-PM10 samplers can be approved for use at source-oriented sites required under paragraph 4.5(a) if the monitoring agency can demonstrate (through modeling or historic monitoring data from the last 3 years) that Pb concentrations (either Pb-TSP or Pb-PM10) will not equal or exceed 0.10 micrograms per cubic meter on an arithmetic 3-month mean and the source is expected to emit a substantial majority of its Pb in the fraction of PM with an aerodynamic diameter of less than or equal to 10 micrometers.
2.10.2 The approval of a Pb-PM10 sampler in lieu of a Pb-TSP sampler as allowed for in paragraph 2.10.1 above will be revoked if measured Pb-PM10 concentrations equal or exceed 0.10 micrograms per cubic meter on an arithmetic 3-month mean. Monitoring agencies will have up to 6 months from the end of the 3-month period in which the arithmetic 3-month Pb-PM10 mean concentration equaled or exceeded 0.10 micrograms per cubic meter to install and begin operation of a Pb-TSP sampler at the site.
3.0 NCore Ambient Air Monitoring Stations
3.1 Methods employed in NCore multipollutant sites used to measure SO2, CO, NO2, O3, PM2.5, or PM10-2.5 must be reference or equivalent methods as defined in § 50.1 of this chapter, or an ARM as defined in section 2.4 of this appendix, for any monitors intended for comparison with applicable NAAQS.
3.2 If alternative SO2, CO, NO2, O3, PM2.5, or PM10-2.5 monitoring methodologies are proposed for monitors not intended for NAAQS comparison, such techniques must be detailed in the network description required by § 58.10 and subsequently approved by the Administrator. Examples of locations that are not intended to be compared to the NAAQS may be rural background and transport sites or areas where the concentration of the pollutant is so low that it would be more useful to operate a higher sensitivity method that is not an FRM or FEM.
4.0 Photochemical Assessment Monitoring Stations (PAMS)
4.1 Methods used for O3 monitoring at PAMS must be automated reference or equivalent methods as defined in § 50.1 of this chapter.
4.2 Methods used for NO, NO2 and NOX monitoring at PAMS should be automated reference or equivalent methods as defined for NO2 in § 50.1 of this chapter. If alternative NO, NO2 or NOX monitoring methodologies are proposed, such techniques must be detailed in the network description required by § 58.10 and subsequently approved by the Administrator.
4.3 Methods for meteorological measurements and speciated VOC monitoring are included in the guidance provided in references 2 and 3 of this appendix. If alternative VOC monitoring methodology (including the use of new or innovative technologies), which is not included in the guidance, is proposed, it must be detailed in the network description required by § 58.10 and subsequently approved by the Administrator.
5.0 Particulate Matter Episode Monitoring
5.1 For short-term measurements of PM10 during air pollution episodes (see § 51.152 of this chapter) the measurement method must be:
5.1.1 Either the “Staggered PM10” method or the “PM10 Sampling Over Short Sampling Times” method, both of which are based on the reference method for PM10 and are described in reference 1: or
5.1.2 Any other method for measuring PM10:
5.1.2.1 Which has a measurement range or ranges appropriate to accurately measure air pollution episode concentration of PM10,
5.1.2.2 Which has a sample period appropriate for short-term PM10 measurements, and
5.1.2.3 For which a quantitative relationship to a reference or equivalent method for PM10 has been established at the use site. Procedures for establishing a quantitative site-specific relationship are contained in reference 1.
5.2 PM10 methods other than the reference method are not covered under the quality assessment requirements of appendix to this part. Therefore, States must develop and implement their own quality assessment procedures for those methods allowed under this section 4. These quality assessment procedures should be similar or analogous to those described in section 3 of appendix A to this part for the PM10 reference method.
6.0 References
1. Pelton, D. J. Guideline for Particulate Episode Monitoring Methods, GEOMET Technologies, Inc., Rockville, MD. Prepared for U.S. Environmental Protection Agency, Research Triangle Park, NC. EPA Contract No. 68-02-3584. EPA 450/4-83-005. February 1983.
2. Technical Assistance Document For Sampling and Analysis of Ozone Precursors. Atmospheric Research and Exposure Assessment Laboratory, U.S. Environmental Protection Agency, Research Triangle Park, NC 27711. EPA 600/8-91-215. October 1991.
3. Quality Assurance Handbook for Air Pollution Measurement Systems: Volume IV. Meteorological Measurements. Atmospheric Research and Exposure Assessment Laboratory, U.S. Environmental Protection Agency, Research Triangle Park, NC 27711. EPA 600/4-90-0003. August 1989.
4. Eldred, R.A., Cahill, T.A., Wilkenson, L.K., et al., Measurements of fine particles and their chemical components in the IMPROVE/NPS networks, in Transactions of the International Specialty Conference on Visibility and Fine Particles, Air and Waste Management Association: Pittsburgh, PA, 1990; pp. 187-196.
5. Sisler, J.F., Huffman, D., and Latimer, D.A.; Spatial and temporal patterns and the chemical composition of the haze in the United States: An analysis of data from the IMPROVE network, 1988-1991, ISSN No. 0737-5253-26, National Park Service, Ft. Collins, CO, 1993.
6. Eldred, R.A., Cahill, T.A., Pitchford, M., and Malm, W.C.; IMPROVE—a new remote area particulate monitoring system for visibility studies, Proceedings of the 81st Annual Meeting of the Air Pollution Control Association, Dallas, Paper 88-54.3, 1988.
7. Data Quality Objectives (DQOs) for Relating Federal Reference Method (FRM) and Continuous PM2.5 Measurements to Report an Air Quality Index (AQI). Office of Air Quality Planning and Standards, U.S. Environmental Protection Agency, Research Triangle Park, NC 27711. EPA 454/B-02-2002. November 2002.
[71 FR 61313, Oct. 17, 2006, as amended at 73 FR 67061, Nov. 12, 2008; 75 FR 6534, Feb. 9, 2010]
Appendix D to Part 58—Network Design Criteria for Ambient Air Quality Monitoring
1. Monitoring Objectives and Spatial Scales
2. General Monitoring Requirements
3. Design Criteria for NCore Sites
4. Pollutant-Specific Design Criteria for SLAMS Sites
5. Design Criteria for Photochemical Assessment Monitoring Stations (PAMS)
6. References
1. Monitoring Objectives and Spatial Scales
The purpose of this appendix is to describe monitoring objectives and general criteria to be applied in establishing the required SLAMS ambient air quality monitoring stations and for choosing general locations for additional monitoring sites. This appendix also describes specific requirements for the number and location of FRM, FEM, and ARM sites for specific pollutants, NCore multipollutant sites, PM10 mass sites, PM2.5 mass sites, chemically-speciated PM2.5 sites, and O3 precursor measurements sites (PAMS). These criteria will be used by EPA in evaluating the adequacy of the air pollutant monitoring networks.
1.1 Monitoring Objectives. The ambient air monitoring networks must be designed to meet three basic monitoring objectives. These basic objectives are listed below. The appearance of any one objective in the order of this list is not based upon a prioritized scheme. Each objective is important and must be considered individually.
(a) Provide air pollution data to the general public in a timely manner. Data can be presented to the public in a number of attractive ways including through air quality maps, newspapers, Internet sites, and as part of weather forecasts and public advisories.
(b) Support compliance with ambient air quality standards and emissions strategy development. Data from FRM, FEM, and ARM monitors for NAAQS pollutants will be used for comparing an area's air pollution levels against the NAAQS. Data from monitors of various types can be used in the development of attainment and maintenance plans. SLAMS, and especially NCore station data, will be used to evaluate the regional air quality models used in developing emission strategies, and to track trends in air pollution abatement control measures' impact on improving air quality. In monitoring locations near major air pollution sources, source-oriented monitoring data can provide insight into how well industrial sources are controlling their pollutant emissions.
(c) Support for air pollution research studies. Air pollution data from the NCore network can be used to supplement data collected by researchers working on health effects assessments and atmospheric processes, or for monitoring methods development work.
1.1.1 In order to support the air quality management work indicated in the three basic air monitoring objectives, a network must be designed with a variety of types of monitoring sites. Monitoring sites must be capable of informing managers about many things including the peak air pollution levels, typical levels in populated areas, air pollution transported into and outside of a city or region, and air pollution levels near specific sources. To summarize some of these sites, here is a listing of six general site types:
(a) Sites located to determine the highest concentrations expected to occur in the area covered by the network.
(b) Sites located to measure typical concentrations in areas of high population density.
(c) Sites located to determine the impact of significant sources or source categories on air quality.
(d) Sites located to determine general background concentration levels.
(e) Sites located to determine the extent of regional pollutant transport among populated areas; and in support of secondary standards.
(f) Sites located to measure air pollution impacts on visibility, vegetation damage, or other welfare-based impacts.
1.1.2 This appendix contains criteria for the basic air monitoring requirements. The total number of monitoring sites that will serve the variety of data needs will be substantially higher than these minimum requirements provide. The optimum size of a particular network involves trade-offs among data needs and available resources. This regulation intends to provide for national air monitoring needs, and to lend support for the flexibility necessary to meet data collection needs of area air quality managers. The EPA, State, and local agencies will periodically collaborate on network design issues through the network assessment process outlined in § 58.10.
1.1.3 This appendix focuses on the relationship between monitoring objectives, site types, and the geographic location of monitoring sites. Included are a rationale and set of general criteria for identifying candidate site locations in terms of physical characteristics which most closely match a specific monitoring objective. The criteria for more specifically locating the monitoring site, including spacing from roadways and vertical and horizontal probe and path placement, are described in appendix E to this part.
1.2 Spatial Scales. (a) To clarify the nature of the link between general monitoring objectives, site types, and the physical location of a particular monitor, the concept of spatial scale of representativeness is defined. The goal in locating monitors is to correctly match the spatial scale represented by the sample of monitored air with the spatial scale most appropriate for the monitoring site type, air pollutant to be measured, and the monitoring objective.
(b) Thus, spatial scale of representativeness is described in terms of the physical dimensions of the air parcel nearest to a monitoring site throughout which actual pollutant concentrations are reasonably similar. The scales of representativeness of most interest for the monitoring site types described above are as follows:
(1) Microscale —Defines the concentrations in air volumes associated with area dimensions ranging from several meters up to about 100 meters.
(2) Middle scale —Defines the concentration typical of areas up to several city blocks in size with dimensions ranging from about 100 meters to 0.5 kilometer.
(3) Neighborhood scale —Defines concentrations within some extended area of the city that has relatively uniform land use with dimensions in the 0.5 to 4.0 kilometers range. The neighborhood and urban scales listed below have the potential to overlap in applications that concern secondarily formed or homogeneously distributed air pollutants.
(4) Urban scale —Defines concentrations within an area of city-like dimensions, on the order of 4 to 50 kilometers. Within a city, the geographic placement of sources may result in there being no single site that can be said to represent air quality on an urban scale.
(5) Regional scale —Defines usually a rural area of reasonably homogeneous geography without large sources, and extends from tens to hundreds of kilometers.
(6) National and global scales —These measurement scales represent concentrations characterizing the nation and the globe as a whole.
(c) Proper siting of a monitor requires specification of the monitoring objective, the types of sites necessary to meet the objective, and then the desired spatial scale of representativeness. For example, consider the case where the objective is to determine NAAQS compliance by understanding the maximum ozone concentrations for an area. Such areas would most likely be located downwind of a metropolitan area, quite likely in a suburban residential area where children and other susceptible individuals are likely to be outdoors. Sites located in these areas are most likely to represent an urban scale of measurement. In this example, physical location was determined by considering ozone precursor emission patterns, public activity, and meteorological characteristics affecting ozone formation and dispersion. Thus, spatial scale of representativeness was not used in the selection process but was a result of site location.
(d) In some cases, the physical location of a site is determined from joint consideration of both the basic monitoring objective and the type of monitoring site desired, or required by this appendix. For example, to determine PM2.5 concentrations which are typical over a geographic area having relatively high PM2.5 concentrations, a neighborhood scale site is more appropriate. Such a site would likely be located in a residential or commercial area having a high overall PM2.5 emission density but not in the immediate vicinity of any single dominant source. Note that in this example, the desired scale of representativeness was an important factor in determining the physical location of the monitoring site.
(e) In either case, classification of the monitor by its type and spatial scale of representativeness is necessary and will aid in interpretation of the monitoring data for a particular monitoring objective (e.g., public reporting, NAAQS compliance, or research support).
(f) Table D-1 of this appendix illustrates the relationship between the various site types that can be used to support the three basic monitoring objectives, and the scales of representativeness that are generally most appropriate for that type of site.
Table D-1 of Appendix D to Part 58—Relationship Between Site Types and Scales of Representativeness
| Site type | Appropriate siting scales |
|---|---|
| 1. Highest concentration | Micro, middle, neighborhood (sometimes urban or regional for secondarily formed pollutants). |
| 2. Population oriented | Neighborhood, urban. |
| 3. Source impact | Micro, middle, neighborhood. |
| 4. General/background & regional transport | Urban, regional. |
| 5. Welfare-related impacts | Urban, regional. |
2. General Monitoring Requirements
(a) The National ambient air monitoring system includes several types of monitoring stations, each targeting a key data collection need and each varying in technical sophistication.
(b) Research grade sites are platforms for scientific studies, either involved with health or welfare impacts, measurement methods development, or other atmospheric studies. These sites may be collaborative efforts between regulatory agencies and researchers with specific scientific objectives for each. Data from these sites might be collected with both traditional and experimental techniques, and data collection might involve specific laboratory analyses not common in routine measurement programs. The research grade sites are not required by regulation; however, they are included here due to their important role in supporting the air quality management program.
(c) The NCore multipollutant sites are sites that measure multiple pollutants in order to provide support to integrated air quality management data needs. NCore sites include both neighborhood and urban scale measurements in general, in a selection of metropolitan areas and a limited number of more rural locations. Continuous monitoring methods are to be used at the NCore sites when available for a pollutant to be measured, as it is important to have data collected over common time periods for integrated analyses. NCore multipollutant sites are intended to be long-term sites useful for a variety of applications including air quality trends analyses, model evaluation, and tracking metropolitan area statistics. As such, the NCore sites should be placed away from direct emission sources that could substantially impact the ability to detect area-wide concentrations. The Administrator must approve the NCore sites.
(d) Monitoring sites designated as SLAMS sites, but not as NCore sites, are intended to address specific air quality management interests, and as such, are frequently single-pollutant measurement sites. The EPA Regional Administrator must approve the SLAMS sites.
(e) This appendix uses the statistical-based definitions for metropolitan areas provided by the Office of Management and Budget and the Census Bureau. These areas are referred to as metropolitan statistical areas (MSA), micropolitan statistical areas, core-based statistical areas (CBSA), and combined statistical areas (CSA). A CBSA associated with at least one urbanized area of 50,000 population or greater is termed a Metropolitan Statistical Area (MSA). A CBSA associated with at least one urbanized cluster of at least 10,000 population or greater is termed a Micropolitan Statistical Area. CSA consist of two or more adjacent CBSA. In this appendix, the term MSA is used to refer to a Metropolitan Statistical Area. By definition, both MSA and CSA have a high degree of integration; however, many such areas cross State or other political boundaries. MSA and CSA may also cross more than one air shed. The EPA recognizes that State or local agencies must consider MSA/CSA boundaries and their own political boundaries and geographical characteristics in designing their air monitoring networks. The EPA recognizes that there may be situations where the EPA Regional Administrator and the affected State or local agencies may need to augment or to divide the overall MSA/CSA monitoring responsibilities and requirements among these various agencies to achieve an effective network design. Full monitoring requirements apply separately to each affected State or local agency in the absence of an agreement between the affected agencies and the EPA Regional Administrator.
3. Design Criteria for NCore Sites
(a) Each State (i.e. the fifty States, District of Columbia, Puerto Rico, and the Virgin Islands) is required to operate at least one NCore site. States may delegate this requirement to a local agency. States with many MSAs often also have multiple air sheds with unique characteristics and, often, elevated air pollution. These States include, at a minimum, California, Florida, Illinois, Michigan, New York, North Carolina, Ohio, Pennsylvania, and Texas. These States are required to identify one to two additional NCore sites in order to account for their unique situations. These additional sites shall be located to avoid proximity to large emission sources. Any State or local agency can propose additional candidate NCore sites or modifications to these requirements for approval by the Administrator. The NCore locations should be leveraged with other multipollutant air monitoring sites including PAMS sites, National Air Toxics Trends Stations (NATTS) sites, CASTNET sites, and STN sites. Site leveraging includes using the same monitoring platform and equipment to meet the objectives of the variety of programs where possible and advantageous.
(b) The NCore sites must measure, at a minimum, PM2.5 particle mass using continuous and integrated/filter-based samplers, speciated PM2.5, PM10-2.5 particle mass, O3, SO2, CO, NO/NOY, wind speed, wind direction, relative humidity, and ambient temperature.
(1) Although the measurement of NOy is required in support of a number of monitoring objectives, available commercial instruments may indicate little difference in their measurement of NOy compared to the conventional measurement of NOX, particularly in areas with relatively fresh sources of nitrogen emissions. Therefore, in areas with negligible expected difference between NOy and NOX measured concentrations, the Administrator may allow for waivers that permit NOX monitoring to be substituted for the required NOy monitoring at applicable NCore sites.
(2) The EPA recognizes that, in some cases, the physical location of the NCore site may not be suitable for representative meteorological measurements due to the site's physical surroundings. It is also possible that nearby meteorological measurements may be able to fulfill this data need. In these cases, the requirement for meteorological monitoring can be waived by the Administrator.
(c) [Reserved]
(d) Siting criteria are provided for urban and rural locations. Sites with significant historical records that do not meet siting criteria may be approved as NCore by the Administrator. Sites with the suite of NCore measurements that are explicitly designed for other monitoring objectives are exempt from these siting criteria (e.g., a near-roadway site).
(1) Urban NCore stations are to be generally located at urban or neighborhood scale to provide representative concentrations of exposure expected throughout the metropolitan area; however, a middle-scale site may be acceptable in cases where the site can represent many such locations throughout a metropolitan area.
(2) Rural NCore stations are to be located to the maximum extent practicable at a regional or larger scale away from any large local emission source, so that they represent ambient concentrations over an extensive area.
4. Pollutant-Specific Design Criteria for SLAMS Sites
4.1 Ozone (O3) Design Criteria. (a) State, and where appropriate, local agencies must operate O3 sites for various locations depending upon area size (in terms of population and geographic characteristics) and typical peak concentrations (expressed in percentages below, or near the O3 NAAQS). Specific SLAMS O3 site minimum requirements are included in Table D-2 of this appendix. The NCore sites are expected to complement the O3 data collection that takes place at single-pollutant SLAMS sites, and both types of sites can be used to meet the network minimum requirements. The total number of O3 sites needed to support the basic monitoring objectives of public data reporting, air quality mapping, compliance, and understanding O3-related atmospheric processes will include more sites than these minimum numbers required in Table D-2 of this appendix. The EPA Regional Administrator and the responsible State or local air monitoring agency must work together to design and/or maintain the most appropriate O3 network to service the variety of data needs in an area.
Table D-2 of Appendix D to Part 58— SLAMS Minimum O3 Monitoring Requirements
| MSA population1 2 | Most recent 3-year design value concentrations ≥85% of any O3 NAAQS3 | Most recent 3-year design value concentrations <85% of any O3 NAAQS3 4 |
|---|---|---|
| >10 million | 4 | 2 |
| 4-10 million | 3 | 1 |
| 350,000-<4 million | 2 | 1 |
| 50,000-<350,0005 | 1 | 0 |
(b) Within an O3 network, at least one O3 site for each MSA, or CSA if multiple MSAs are involved, must be designed to record the maximum concentration for that particular metropolitan area. More than one maximum concentration site may be necessary in some areas. Table D-2 of this appendix does not account for the full breadth of additional factors that would be considered in designing a complete O3 monitoring program for an area. Some of these additional factors include geographic size, population density, complexity of terrain and meteorology, adjacent O3 monitoring programs, air pollution transport from neighboring areas, and measured air quality in comparison to all forms of the O3 NAAQS (i.e., 8-hour and 1-hour forms). Networks must be designed to account for all of these area characteristics. Network designs must be re-examined in periodic network assessments. Deviations from the above O3 requirements are allowed if approved by the EPA Regional Administrator.
(c) The appropriate spatial scales for O3 sites are neighborhood, urban, and regional. Since O3 requires appreciable formation time, the mixing of reactants and products occurs over large volumes of air, and this reduces the importance of monitoring small scale spatial variability.
(1) Neighborhood scale —Measurements in this category represent conditions throughout some reasonably homogeneous urban sub-region, with dimensions of a few kilometers. Homogeneity refers to pollutant concentrations. Neighborhood scale data will provide valuable information for developing, testing, and revising concepts and models that describe urban/regional concentration patterns. These data will be useful to the understanding and definition of processes that take periods of hours to occur and hence involve considerable mixing and transport. Under stagnation conditions, a site located in the neighborhood scale may also experience peak concentration levels within a metropolitan area.
(2) Urban scale —Measurement in this scale will be used to estimate concentrations over large portions of an urban area with dimensions of several kilometers to 50 or more kilometers. Such measurements will be used for determining trends, and designing area-wide control strategies. The urban scale sites would also be used to measure high concentrations downwind of the area having the highest precursor emissions.
(3) Regional scale —This scale of measurement will be used to typify concentrations over large portions of a metropolitan area and even larger areas with dimensions of as much as hundreds of kilometers. Such measurements will be useful for assessing the O3 that is transported to and from a metropolitan area, as well as background concentrations. In some situations, particularly when considering very large metropolitan areas with complex source mixtures, regional scale sites can be the maximum concentration location.
(d) EPA's technical guidance documents on O3 monitoring network design should be used to evaluate the adequacy of each existing O3 monitor, to relocate an existing site, or to locate any new O3 sites.
(e) For locating a neighborhood scale site to measure typical city concentrations, a reasonably homogeneous geographical area near the center of the region should be selected which is also removed from the influence of major NOX sources. For an urban scale site to measure the high concentration areas, the emission inventories should be used to define the extent of the area of important nonmethane hydrocarbons and NOX emissions. The meteorological conditions that occur during periods of maximum photochemical activity should be determined. These periods can be identified by examining the meteorological conditions that occur on the highest O3 air quality days. Trajectory analyses, an evaluation of wind and emission patterns on high O3 days, can also be useful in evaluating an O3 monitoring network. In areas without any previous O3 air quality measurements, meteorological and O3 precursor emissions information would be useful.
(f) Once the meteorological and air quality data are reviewed, the prospective maximum concentration monitor site should be selected in a direction from the city that is most likely to observe the highest O3 concentrations, more specifically, downwind during periods of photochemical activity. In many cases, these maximum concentration O3 sites will be located 10 to 30 miles or more downwind from the urban area where maximum O3 precursor emissions originate. The downwind direction and appropriate distance should be determined from historical meteorological data collected on days which show the potential for producing high O3 levels. Monitoring agencies are to consult with their EPA Regional Office when considering siting a maximum O3 concentration site.
(g) In locating a neighborhood scale site which is to measure high concentrations, the same procedures used for the urban scale are followed except that the site should be located closer to the areas bordering on the center city or slightly further downwind in an area of high density population.
(h) For regional scale background monitoring sites, similar meteorological analysis as for the maximum concentration sites may also inform the decisions for locating regional scale sites. Regional scale sites may be located to provide data on O3 transport between cities, as background sites, or for other data collection purposes. Consideration of both area characteristics, such as meteorology, and the data collection objectives, such as transport, must be jointly considered for a regional scale site to be useful.
(i) Ozone monitoring is required at SLAMS monitoring sites only during the seasons of the year that are conducive to O3 formation (i.e., “ozone season”) as described below in Table D-3 of this appendix. These O3 seasons are also identified in the AQS files on a state-by-state basis. Deviations from the O3 monitoring season must be approved by the EPA Regional Administrator. These requests will be reviewed by Regional Administrators taking into consideration, at a minimum, the frequency of out-of-season O3 NAAQS exceedances, as well as occurrences of the Moderate air quality index level, regional consistency, and logistical issues such as site access. Any deviations based on the Regional Administrator's waiver of requirements must be described in the annual monitoring network plan and updated in AQS. Changes to the O3 monitoring season requirements in Table D-3 revoke all previously approved Regional Administrator waivers. Requests for monitoring season deviations must be accompanied by relevant supporting information. Information on how to analyze O3 data to support a change to the O3 season in support of the 8-hour standard for the entire network in a specific state can be found in reference 8 to this appendix. Ozone monitors at NCore stations are required to be operated year-round (January to December).
Table D-31 to Appendix D of part 58. Ozone Monitoring Season by state
| State | Begin Month | End Month |
|---|---|---|
| Alabama | March | October. |
| Alaska | April | October. |
| Arizona | January | December. |
| Arkansas | March | November. |
| California | January | December. |
| Colorado | January | December. |
| Connecticut | March | September. |
| Delaware | March | October. |
| District of Columbia | March | October. |
| Florida | January | December. |
| Georgia | March | October. |
| Hawaii | January | December. |
| Idaho | April | September. |
| Illinois | March | October. |
| Indiana | March | October. |
| Iowa | March | October. |
| Kansas | March | October. |
| Kentucky | March | October. |
| Louisiana (Northern) AQCR 019, 022 | March | October. |
| Louisiana (Southern) AQCR 106 | January | December. |
| Maine | April | September. |
| Maryland | March | October. |
| Massachusetts | March | September. |
| Michigan | March | October. |
| Minnesota | March | October. |
| Mississippi | March | October. |
| Missouri | March | October. |
| Montana | April | September. |
| Nebraska | March | October. |
| Nevada | January | December. |
| New Hampshire | March | September. |
| New Jersey | March | October. |
| New Mexico | January | December. |
| New York | March | October. |
| North Carolina | March | October. |
| North Dakota | March | September. |
| Ohio | March | October. |
| Oklahoma | March | November. |
| Oregon | May | September. |
| Pennsylvania | March | October. |
| Puerto Rico | January | December. |
| Rhode Island | March | September. |
| South Carolina | March | October. |
| South Dakota | March | October. |
| Tennessee | March | October. |
| Texas (Northern) AQCR 022, 210, 211, 212, 215, 217, 218 | March | November. |
| Texas (Southern) AQCR 106, 153, 213, 214, 216 | January | December. |
| Utah | January | December. |
| Vermont | April | September. |
| Virginia | March | October. |
| Washington | May | September. |
| West Virginia | March | October. |
| Wisconsin | March | October 15. |
| Wyoming | January | September. |
| American Samoa | January | December. |
| Guam | January | December. |
| Virgin Islands | January | December. |
4.2 Carbon Monoxide (CO) Design Criteria
4.2.1 General Requirements. (a) Except as provided in subsection (b), one CO monitor is required to operate collocated with one required near-road NO2 monitor, as required in Section 4.3.2 of this part, in CBSAs having a population of 1,000,000 or more persons. If a CBSA has more than one required near-road NO2 monitor, only one CO monitor is required to be collocated with a near-road NO2 monitor within that CBSA.
(b) If a state provides quantitative evidence demonstrating that peak ambient CO concentrations would occur in a near-road location which meets microscale siting criteria in Appendix E of this part but is not a near-road NO2 monitoring site, then the EPA Regional Administrator may approve a request by a state to use such an alternate near-road location for a CO monitor in place of collocating a monitor at near-road NO2 monitoring site.
4.2.2 Regional Administrator Required Monitoring. (a) The Regional Administrators, in collaboration with states, may require additional CO monitors above the minimum number of monitors required in 4.2.1 of this part, where the minimum monitoring requirements are not sufficient to meet monitoring objectives. The Regional Administrator may require, at his/her discretion, additional monitors in situations where data or other information suggest that CO concentrations may be approaching or exceeding the NAAQS. Such situations include, but are not limited to, (1) characterizing impacts on ground-level concentrations due to stationary CO sources, (2) characterizing CO concentrations in downtown areas or urban street canyons, and (3) characterizing CO concentrations in areas that are subject to high ground level CO concentrations particularly due to or enhanced by topographical and meteorological impacts. The Regional Administrator and the responsible State or local air monitoring agency shall work together to design and maintain the most appropriate CO network to address the data needs for an area, and include all monitors under this provision in the annual monitoring network plan.
4.2.3 CO Monitoring Spatial Scales. (a) Microscale and middle scale measurements are the most useful site classifications for CO monitoring sites since most people have the potential for exposure on these scales. Carbon monoxide maxima occur primarily in areas near major roadways and intersections with high traffic density and often in areas with poor atmospheric ventilation.
(1) Microscale —Microscale measurements typically represent areas in close proximity to major roadways, within street canyons, over sidewalks, and in some cases, point and area sources. Emissions on roadways result in high ground level CO concentrations at the microscale, where concentration gradients generally exhibit a marked decrease with increasing downwind distance from major roads, or within downtown areas including urban street canyons. Emissions from stationary point and area sources, and non-road sources may, under certain plume conditions, result in high ground level concentrations at the microscale.
(2) Middle scale —Middle scale measurements are intended to represent areas with dimensions from 100 meters to 0.5 kilometer. In certain cases, middle scale measurements may apply to areas that have a total length of several kilometers, such as “line” emission source areas. This type of emission sources areas would include air quality along a commercially developed street or shopping plaza, freeway corridors, parking lots and feeder streets.
(3) Neighborhood scale —Neighborhood scale measurements are intended to represent areas with dimensions from 0.5 kilometers to 4 kilometers. Measurements of CO in this category would represent conditions throughout some reasonably urban sub-regions. In some cases, neighborhood scale data may represent not only the immediate neighborhood spatial area, but also other similar such areas across the larger urban area. Neighborhood scale measurements provide relative area-wide concentration data which are useful for providing relative urban background concentrations, supporting health and scientific research, and for use in modeling.
4.3 Nitrogen Dioxide (NO2) Design Criteria
4.3.1 General Requirements
(a) State and, where appropriate, local agencies must operate a minimum number of required NO2 monitoring sites as described below.
4.3.2 Requirement for Near-road NO2 Monitors
(a) Within the NO2 network, there must be one microscale near-road NO2 monitoring station in each CBSA with a population of 1,000,000 or more persons to monitor a location of expected maximum hourly concentrations sited near a major road with high AADT counts as specified in paragraph 4.3.2(a)(1) of this appendix. An additional near-road NO2 monitoring station is required for any CBSA with a population of 2,500,000 persons or more, or in any CBSA with a population of 1,000,000 or more persons that has one or more roadway segments with 250,000 or greater AADT counts to monitor a second location of expected maximum hourly concentrations. CBSA populations shall be based on the latest available census figures.
(1) The near-road NO2 monitoring sites shall be selected by ranking all road segments within a CBSA by AADT and then identifying a location or locations adjacent to those highest ranked road segments, considering fleet mix, roadway design, congestion patterns, terrain, and meteorology, where maximum hourly NO2 concentrations are expected to occur and siting criteria can be met in accordance with appendix E of this part. Where a state or local air monitoring agency identifies multiple acceptable candidate sites where maximum hourly NO2 concentrations are expected to occur, the monitoring agency shall consider the potential for population exposure in the criteria utilized to select the final site location. Where one CBSA is required to have two near-road NO2 monitoring stations, the sites shall be differentiated from each other by one or more of the following factors: fleet mix; congestion patterns; terrain; geographic area within the CBSA; or different route, interstate, or freeway designation.
(b) Measurements at required near-road NO2 monitor sites utilizing chemiluminescence FRMs must include at a minimum: NO, NO2, and NOX.
4.3.3 Requirement for Area-wide NO2 Monitoring
(a) Within the NO2 network, there must be one monitoring station in each CBSA with a population of 1,000,000 or more persons to monitor a location of expected highest NO2 concentrations representing the neighborhood or larger spatial scales. PAMS sites collecting NO2 data that are situated in an area of expected high NO2 concentrations at the neighborhood or larger spatial scale may be used to satisfy this minimum monitoring requirement when the NO2 monitor is operated year round. Emission inventories and meteorological analysis should be used to identify the appropriate locations within a CBSA for locating required area-wide NO2 monitoring stations. CBSA populations shall be based on the latest available census figures.
4.3.4 Regional Administrator Required Monitoring
(a) The Regional Administrators, in collaboration with States, must require a minimum of forty additional NO2 monitoring stations nationwide in any area, inside or outside of CBSAs, above the minimum monitoring requirements, with a primary focus on siting these monitors in locations to protect susceptible and vulnerable populations. The Regional Administrators, working with States, may also consider additional factors described in paragraph (b) below to require monitors beyond the minimum network requirement.
(b) The Regional Administrators may require monitors to be sited inside or outside of CBSAs in which:
(i) The required near-road monitors do not represent all locations of expected maximum hourly NO2 concentrations in an area and NO2 concentrations may be approaching or exceeding the NAAQS in that area;
(ii) Areas that are not required to have a monitor in accordance with the monitoring requirements and NO2 concentrations may be approaching or exceeding the NAAQS; or
(iii) The minimum monitoring requirements for area-wide monitors are not sufficient to meet monitoring objectives.
(c) The Regional Administrator and the responsible State or local air monitoring agency should work together to design and/or maintain the most appropriate NO2 network to address the data needs for an area, and include all monitors under this provision in the annual monitoring network plan.
4.3.5 NO2 Monitoring Spatial Scales
(a) The most important spatial scale for near-road NO2 monitoring stations to effectively characterize the maximum expected hourly NO2 concentration due to mobile source emissions on major roadways is the microscale. The most important spatial scales for other monitoring stations characterizing maximum expected hourly NO2 concentrations are the microscale and middle scale. The most important spatial scale for area-wide monitoring of high NO2 concentrations is the neighborhood scale.
(1) Microscale —This scale represents areas in close proximity to major roadways or point and area sources. Emissions from roadways result in high ground level NO2 concentrations at the microscale, where concentration gradients generally exhibit a marked decrease with increasing downwind distance from major roads. As noted in appendix E of this part, near-road NO2 monitoring stations are required to be within 50 meters of target road segments in order to measure expected peak concentrations. Emissions from stationary point and area sources, and non-road sources may, under certain plume conditions, result in high ground level concentrations at the microscale. The microscale typically represents an area impacted by the plume with dimensions extending up to approximately 100 meters.
(2) Middle scale —This scale generally represents air quality levels in areas up to several city blocks in size with dimensions on the order of approximately 100 meters to 500 meters. The middle scale may include locations of expected maximum hourly concentrations due to proximity to major NO2 point, area, and/or non-road sources.
(3) Neighborhood scale —The neighborhood scale represents air quality conditions throughout some relatively uniform land use areas with dimensions in the 0.5 to 4.0 kilometer range. Emissions from stationary point and area sources may, under certain plume conditions, result in high NO2 concentrations at the neighborhood scale. Where a neighborhood site is located away from immediate NO2 sources, the site may be useful in representing typical air quality values for a larger residential area, and therefore suitable for population exposure and trends analyses.
(4) Urban scale —Measurements in this scale would be used to estimate concentrations over large portions of an urban area with dimensions from 4 to 50 kilometers. Such measurements would be useful for assessing trends in area-wide air quality, and hence, the effectiveness of large scale air pollution control strategies. Urban scale sites may also support other monitoring objectives of the NO2 monitoring network identified in paragraph 4.3.4 above.
4.3.6 NOy Monitoring
(a) NO/NOy measurements are included within the NCore multi-pollutant site requirements and the PAMS program. These NO/NOy measurements will produce conservative estimates for NO2 that can be used to ensure tracking continued compliance with the NO2 NAAQS. NO/NOy monitors are used at these sites because it is important to collect data on total reactive nitrogen species for understanding O3 photochemistry.
4.4 Sulfur Dioxide (SO2) Design Criteria.
4.4.1 General Requirements. (a) State and, where appropriate, local agencies must operate a minimum number of required SO2 monitoring sites as described below.
4.4.2 Requirement for Monitoring by the Population Weighted Emissions Index. (a) The population weighted emissions index (PWEI) shall be calculated by States for each core based statistical area (CBSA) they contain or share with another State or States for use in the implementation of or adjustment to the SO2 monitoring network. The PWEI shall be calculated by multiplying the population of each CBSA, using the most current census data or estimates, and the total amount of SO2 in tons per year emitted within the CBSA area, using an aggregate of the most recent county level emissions data available in the National Emissions Inventory for each county in each CBSA. The resulting product shall be divided by one million, providing a PWEI value, the units of which are million persons-tons per year. For any CBSA with a calculated PWEI value equal to or greater than 1,000,000, a minimum of three SO2 monitors are required within that CBSA. For any CBSA with a calculated PWEI value equal to or greater than 100,000, but less than 1,000,000, a minimum of two SO2 monitors are required within that CBSA. For any CBSA with a calculated PWEI value equal to or greater than 5,000, but less than 100,000, a minimum of one SO2 monitor is required within that CBSA.
(1) The SO2 monitoring site(s) required as a result of the calculated PWEI in each CBSA shall satisfy minimum monitoring requirements if the monitor is sited within the boundaries of the parent CBSA and is one of the following site types (as defined in section 1.1.1 of this appendix): population exposure, highest concentration, source impacts, general background, or regional transport. SO2 monitors at NCore stations may satisfy minimum monitoring requirements if that monitor is located within a CBSA with minimally required monitors under this part. Any monitor that is sited outside of a CBSA with minimum monitoring requirements to assess the highest concentration resulting from the impact of significant sources or source categories existing within that CBSA shall be allowed to count towards minimum monitoring requirements for that CBSA.
4.4.3 Regional Administrator Required Monitoring. (a) The Regional Administrator may require additional SO2 monitoring stations above the minimum number of monitors required in 4.4.2 of this part, where the minimum monitoring requirements are not sufficient to meet monitoring objectives. The Regional Administrator may require, at his/her discretion, additional monitors in situations where an area has the potential to have concentrations that may violate or contribute to the violation of the NAAQS, in areas impacted by sources which are not conducive to modeling, or in locations with susceptible and vulnerable populations, which are not monitored under the minimum monitoring provisions described above. The Regional Administrator and the responsible State or local air monitoring agency shall work together to design and/or maintain the most appropriate SO2 network to provide sufficient data to meet monitoring objectives.
4.4.4 SO2 Monitoring Spatial Scales. (a) The appropriate spatial scales for SO2 SLAMS monitors are the microscale, middle, neighborhood, and urban scales. Monitors sited at the microscale, middle, and neighborhood scales are suitable for determining maximum hourly concentrations for SO2. Monitors sited at urban scales are useful for identifying SO2 transport, trends, and, if sited upwind of local sources, background concentrations.
(1) Microscale—This scale would typify areas in close proximity to SO2 point and area sources. Emissions from stationary point and area sources, and non-road sources may, under certain plume conditions, result in high ground level concentrations at the microscale. The microscale typically represents an area impacted by the plume with dimensions extending up to approximately 100 meters.
(2) Middle scale —This scale generally represents air quality levels in areas up to several city blocks in size with dimensions on the order of approximately 100 meters to 500 meters. The middle scale may include locations of expected maximum short-term concentrations due to proximity to major SO2 point, area, and/or non-road sources.
(3) Neighborhood scale —The neighborhood scale would characterize air quality conditions throughout some relatively uniform land use areas with dimensions in the 0.5 to 4.0 kilometer range. Emissions from stationary point and area sources may, under certain plume conditions, result in high SO2 concentrations at the neighborhood scale. Where a neighborhood site is located away from immediate SO2 sources, the site may be useful in representing typical air quality values for a larger residential area, and therefore suitable for population exposure and trends analyses.
(4) Urban scale —Measurements in this scale would be used to estimate concentrations over large portions of an urban area with dimensions from 4 to 50 kilometers. Such measurements would be useful for assessing trends in area-wide air quality, and hence, the effectiveness of large scale air pollution control strategies. Urban scale sites may also support other monitoring objectives of the SO2 monitoring network such as identifying trends, and when monitors are sited upwind of local sources, background concentrations.
4.4.5 NCore Monitoring. (a) SO2 measurements are included within the NCore multipollutant site requirements as described in paragraph (3)(b) of this appendix. NCore-based SO2 measurements are primarily used to characterize SO2 trends and assist in understanding SO2 transport across representative areas in urban or rural locations and are also used for comparison with the SO2 NAAQS. SO2 monitors at NCore sites that exist in CBSAs with minimum monitoring requirements per section 4.4.2 above shall be allowed to count towards those minimum monitoring requirements.
4.5 Lead (Pb) Design Criteria. (a) State and, where appropriate, local agencies are required to conduct ambient air Pb monitoring near Pb sources which are expected to or have been shown to contribute to a maximum Pb concentration in ambient air in excess of the NAAQS, taking into account the logistics and potential for population exposure. At a minimum, there must be one source-oriented SLAMS site located to measure the maximum Pb concentration in ambient air resulting from each non-airport Pb source which emits 0.50 or more tons per year and from each airport which emits 1.0 or more tons per year based on either the most recent National Emission Inventory (http://www.epa.gov/ttn/chief/eiinformation.html) or other scientifically justifiable methods and data (such as improved emissions factors or site-specific data) taking into account logistics and the potential for population exposure.
(i) One monitor may be used to meet the requirement in paragraph 4.5(a) for all sources involved when the location of the maximum Pb concentration due to one Pb source is expected to also be impacted by Pb emissions from a nearby source (or multiple sources). This monitor must be sited, taking into account logistics and the potential for population exposure, where the Pb concentration from all sources combined is expected to be at its maximum.
(ii) The Regional Administrator may waive the requirement in paragraph 4.5(a) for monitoring near Pb sources if the State or, where appropriate, local agency can demonstrate the Pb source will not contribute to a maximum Pb concentration in ambient air in excess of 50 percent of the NAAQS (based on historical monitoring data, modeling, or other means). The waiver must be renewed once every 5 years as part of the network assessment required under § 58.10(d).
(iii) State and, where appropriate, local agencies are required to conduct ambient air Pb monitoring near each of the airports listed in Table D-3A for a period of 12 consecutive months commencing no later than December 27, 2011. Monitors shall be sited to measure the maximum Pb concentration in ambient air, taking into account logistics and the potential for population exposure, and shall use an approved Pb-TSP Federal Reference Method or Federal Equivalent Method. Any monitor that exceeds 50 percent of the Pb NAAQS on a rolling 3-month average (as determined according to 40 CFR part 50, Appendix R) shall become a required monitor under paragraph 4.5(c) of this Appendix, and shall continue to monitor for Pb unless a waiver is granted allowing it to stop operating as allowed by the provisions in paragraph 4.5(a)(ii) of this appendix. Data collected shall be submitted to the Air Quality System database according to the requirements of 40 CFR part 58.16.
Table D-3A Airports To Be Monitored for Lead
| Airport | County | State |
|---|---|---|
| Merrill Field | Anchorage | AK |
| Pryor Field Regional | Limestone | AL |
| Palo Alto Airport of Santa Clara County | Santa Clara | CA |
| McClellan-Palomar | San Diego | CA |
| Reid-Hillview | Santa Clara | CA |
| Gillespie Field | San Diego | CA |
| San Carlos | San Mateo | CA |
| Nantucket Memorial | Nantucket | MA |
| Oakland County International | Oakland | MI |
| Republic | Suffolk | NY |
| Brookhaven | Suffolk | NY |
| Stinson Municipal | Bexar | TX |
| Northwest Regional | Denton | TX |
| Harvey Field | Snohomish | WA |
| Auburn Municipal | King | WA |
(b) [Reserved]
(c) The EPA Regional Administrator may require additional monitoring beyond the minimum monitoring requirements contained in paragraph 4.5(a) of this appendix where the likelihood of Pb air quality violations is significant or where the emissions density, topography, or population locations are complex and varied. The EPA Regional Administrators may require additional monitoring at locations including, but not limited to, those near existing additional industrial sources of Pb, recently closed industrial sources of Pb, airports where piston-engine aircraft emit Pb, and other sources of re-entrained Pb dust.
(d) The most important spatial scales for source-oriented sites to effectively characterize the emissions from point sources are microscale and middle scale. The most important spatial scale for non-source-oriented sites to characterize typical lead concentrations in urban areas is the neighborhood scale. Monitor siting should be conducted in accordance with 4.5(a)(i) with respect to source-oriented sites.
(1) Microscale—This scale would typify areas in close proximity to lead point sources. Emissions from point sources such as primary and secondary lead smelters, and primary copper smelters may under fumigation conditions likewise result in high ground level concentrations at the microscale. In the latter case, the microscale would represent an area impacted by the plume with dimensions extending up to approximately 100 meters. Pb monitors in areas where the public has access, and particularly children have access, are desirable because of the higher sensitivity of children to exposures of elevated Pb concentrations.
(2) Middle scale—This scale generally represents Pb air quality levels in areas up to several city blocks in size with dimensions on the order of approximately 100 meters to 500 meters. The middle scale may for example, include schools and playgrounds in center city areas which are close to major Pb point sources. Pb monitors in such areas are desirable because of the higher sensitivity of children to exposures of elevated Pb concentrations (reference 3 of this appendix). Emissions from point sources frequently impact on areas at which single sites may be located to measure concentrations representing middle spatial scales.
(3) Neighborhood scale—The neighborhood scale would characterize air quality conditions throughout some relatively uniform land use areas with dimensions in the 0.5 to 4.0 kilometer range. Sites of this scale would provide monitoring data in areas representing conditions where children live and play. Monitoring in such areas is important since this segment of the population is more susceptible to the effects of Pb. Where a neighborhood site is located away from immediate Pb sources, the site may be very useful in representing typical air quality values for a larger residential area, and therefore suitable for population exposure and trends analyses.
(d) Technical guidance is found in references 4 and 5 of this appendix. These documents provide additional guidance on locating sites to meet specific urban area monitoring objectives and should be used in locating new sites or evaluating the adequacy of existing sites.
4.6 Particulate Matter (PM10) Design Criteria.>(a) Table D-4 indicates the approximate number of permanent stations required in MSAs to characterize national and regional PM10 air quality trends and geographical patterns. The number of PM10 stations in areas where MSA populations exceed 1,000,000 must be in the range from 2 to 10 stations, while in low population urban areas, no more than two stations are required. A range of monitoring stations is specified in Table D-4 because sources of pollutants and local control efforts can vary from one part of the country to another and therefore, some flexibility is allowed in selecting the actual number of stations in any one locale. Modifications from these PM10 monitoring requirements must be approved by the Regional Administrator.
Table D-4 of Appendix D to Part 58—PM10 Minimum Monitoring Requirements (Approximate Number of Stations Per MSA)1
| Population category | High concentration2 | Medium concentration3 | Low concentration4 5 |
|---|---|---|---|
| >1,000,000 | 6-10 | 4-8 | 2-4 |
| 500,000-1,000,000 | 4-8 | 2-4 | 1-2 |
| 250,000-500,000 | 3-4 | 1-2 | 0-1 |
| 100,000-250,000 | 1-2 | 0-1 | 0 |
(b) Although microscale monitoring may be appropriate in some circumstances, the most important spatial scales to effectively characterize the emissions of PM10 from both mobile and stationary sources are the middle scales and neighborhood scales.
(1) Microscale —This scale would typify areas such as downtown street canyons, traffic corridors, and fence line stationary source monitoring locations where the general public could be exposed to maximum PM10 concentrations. Microscale particulate matter sites should be located near inhabited buildings or locations where the general public can be expected to be exposed to the concentration measured. Emissions from stationary sources such as primary and secondary smelters, power plants, and other large industrial processes may, under certain plume conditions, likewise result in high ground level concentrations at the microscale. In the latter case, the microscale would represent an area impacted by the plume with dimensions extending up to approximately 100 meters. Data collected at microscale sites provide information for evaluating and developing hot spot control measures.
(2) Middle scale —Much of the short-term public exposure to coarse fraction particles (PM10) is on this scale and on the neighborhood scale. People moving through downtown areas or living near major roadways or stationary sources, may encounter particulate pollution that would be adequately characterized by measurements of this spatial scale. Middle scale PM10 measurements can be appropriate for the evaluation of possible short-term exposure public health effects. In many situations, monitoring sites that are representative of micro-scale or middle-scale impacts are not unique and are representative of many similar situations. This can occur along traffic corridors or other locations in a residential district. In this case, one location is representative of a neighborhood of small scale sites and is appropriate for evaluation of long-term or chronic effects. This scale also includes the characteristic concentrations for other areas with dimensions of a few hundred meters such as the parking lot and feeder streets associated with shopping centers, stadia, and office buildings. In the case of PM10, unpaved or seldomly swept parking lots associated with these sources could be an important source in addition to the vehicular emissions themselves.
(3) Neighborhood scale —Measurements in this category represent conditions throughout some reasonably homogeneous urban sub-region with dimensions of a few kilometers and of generally more regular shape than the middle scale. Homogeneity refers to the particulate matter concentrations, as well as the land use and land surface characteristics. In some cases, a location carefully chosen to provide neighborhood scale data would represent not only the immediate neighborhood but also neighborhoods of the same type in other parts of the city. Neighborhood scale PM10 sites provide information about trends and compliance with standards because they often represent conditions in areas where people commonly live and work for extended periods. Neighborhood scale data could provide valuable information for developing, testing, and revising models that describe the larger-scale concentration patterns, especially those models relying on spatially smoothed emission fields for inputs. The neighborhood scale measurements could also be used for neighborhood comparisons within or between cities.
4.7 Fine Particulate Matter (PM2.5) Design Criteria.
4.7.1 General Requirements. (a) State, and where applicable local, agencies must operate the minimum number of required PM2.5 SLAMS sites listed in Table D-5 of this appendix. The NCore sites are expected to complement the PM2.5 data collection that takes place at non-NCore SLAMS sites, and both types of sites can be used to meet the minimum PM2.5 network requirements. Deviations from these PM2.5 monitoring requirements must be approved by the EPA Regional Administrator.
Table D-5 of Appendix D to Part 58—PM2.5 Minimum Monitoring Requirements
| MSA population1 2 | Most recent 3-year design value ≥85% of any PM2.5 NAAQS3 | Most recent 3-year design value <85% of any PM2.5 NAAQS3 4 |
|---|---|---|
| >1,000,000 | 3 | 2 |
| 500,000-1,000,000 | 2 | 1 |
| 50,000-<500,0005 | 1 | 0 |
(b) Specific Design Criteria for PM2.5. The required monitoring stations or sites must be sited to represent area-wide air quality. These sites can include sites collocated at PAMS. These monitoring stations will typically be at neighborhood or urban-scale; however, micro-or middle-scale PM2.5 monitoring sites that represent many such locations throughout a metropolitan area are considered to represent area-wide air quality.
(1) At least one monitoring station is to be sited at neighborhood or larger scale in an area of expected maximum concentration.
(2) For CBSAs with a population of 1,000,000 or more persons, at least one PM2.5 monitor is to be collocated at a near-road NO2 station required in section 4.3.2(a) of this appendix.
(3) For areas with additional required SLAMS, a monitoring station is to be sited in an area of poor air quality.
(4) Additional technical guidance for siting PM2.5 monitors is provided in references 6 and 7 of this appendix.
(c) The most important spatial scale to effectively characterize the emissions of particulate matter from both mobile and stationary sources is the neighborhood scale for PM2.5. For purposes of establishing monitoring sites to represent large homogenous areas other than the above scales of representativeness and to characterize regional transport, urban or regional scale sites would also be needed. Most PM2.5 monitoring in urban areas should be representative of a neighborhood scale.
(1) Micro-scale. This scale would typify areas such as downtown street canyons and traffic corridors where the general public would be exposed to maximum concentrations from mobile sources. In some circumstances, the micro-scale is appropriate for particulate sites. SLAMS sites measured at the micro-scale level should, however, be limited to urban sites that are representative of long-term human exposure and of many such microenvironments in the area. In general, micro-scale particulate matter sites should be located near inhabited buildings or locations where the general public can be expected to be exposed to the concentration measured. Emissions from stationary sources such as primary and secondary smelters, power plants, and other large industrial processes may, under certain plume conditions, likewise result in high ground level concentrations at the micro-scale. In the latter case, the micro-scale would represent an area impacted by the plume with dimensions extending up to approximately 100 meters. Data collected at micro-scale sites provide information for evaluating and developing hot spot control measures.
(2) Middle scale —People moving through downtown areas, or living near major roadways, encounter particle concentrations that would be adequately characterized by this spatial scale. Thus, measurements of this type would be appropriate for the evaluation of possible short-term exposure public health effects of particulate matter pollution. In many situations, monitoring sites that are representative of microscale or middle-scale impacts are not unique and are representative of many similar situations. This can occur along traffic corridors or other locations in a residential district. In this case, one location is representative of a number of small scale sites and is appropriate for evaluation of long-term or chronic effects. This scale also includes the characteristic concentrations for other areas with dimensions of a few hundred meters such as the parking lot and feeder streets associated with shopping centers, stadia, and office buildings.
(3) Neighborhood scale —Measurements in this category would represent conditions throughout some reasonably homogeneous urban sub-region with dimensions of a few kilometers and of generally more regular shape than the middle scale. Homogeneity refers to the particulate matter concentrations, as well as the land use and land surface characteristics. Much of the PM2.5 exposures are expected to be associated with this scale of measurement. In some cases, a location carefully chosen to provide neighborhood scale data would represent the immediate neighborhood as well as neighborhoods of the same type in other parts of the city. PM2.5 sites of this kind provide good information about trends and compliance with standards because they often represent conditions in areas where people commonly live and work for periods comparable to those specified in the NAAQS. In general, most PM2.5 monitoring in urban areas should have this scale.
(4) Urban scale —This class of measurement would be used to characterize the particulate matter concentration over an entire metropolitan or rural area ranging in size from 4 to 50 kilometers. Such measurements would be useful for assessing trends in area-wide air quality, and hence, the effectiveness of large scale air pollution control strategies. Community-oriented PM2.5 sites may have this scale.
(5) Regional scale —These measurements would characterize conditions over areas with dimensions of as much as hundreds of kilometers. As noted earlier, using representative conditions for an area implies some degree of homogeneity in that area. For this reason, regional scale measurements would be most applicable to sparsely populated areas. Data characteristics of this scale would provide information about larger scale processes of particulate matter emissions, losses and transport. PM2.5 transport contributes to elevated particulate concentrations and may affect multiple urban and State entities with large populations such as in the eastern United States. Development of effective pollution control strategies requires an understanding at regional geographical scales of the emission sources and atmospheric processes that are responsible for elevated PM2.5 levels and may also be associated with elevated O3 and regional haze.
4.7.2 Requirement for Continuous PM2.5 Monitoring. The State, or where appropriate, local agencies must operate continuous PM2.5 analyzers equal to at least one-half (round up) the minimum required sites listed in Table D-5 of this appendix. At least one required continuous analyzer in each MSA must be collocated with one of the required FRM/FEM/ARM monitors, unless at least one of the required FRM/FEM/ARM monitors is itself a continuous FEM or ARM monitor in which case no collocation requirement applies. State and local air monitoring agencies must use methodologies and quality assurance/quality control (QA/QC) procedures approved by the EPA Regional Administrator for these required continuous analyzers.
4.7.3 Requirement for PM2.5 Background and Transport Sites. Each State shall install and operate at least one PM2.5 site to monitor for regional background and at least one PM2.5 site to monitor regional transport. These monitoring sites may be at community-oriented sites and this requirement may be satisfied by a corresponding monitor in an area having similar air quality in another State. State and local air monitoring agencies must use methodologies and QA/QC procedures approved by the EPA Regional Administrator for these sites. Methods used at these sites may include non-federal reference method samplers such as IMPROVE or continuous PM2.5 monitors.
4.7.4 PM2.5 Chemical Speciation Site Requirements. Each State shall continue to conduct chemical speciation monitoring and analyses at sites designated to be part of the PM2.5 Speciation Trends Network (STN). The selection and modification of these STN sites must be approved by the Administrator. The PM2.5 chemical speciation urban trends sites shall include analysis for elements, selected anions and cations, and carbon. Samples must be collected using the monitoring methods and the sampling schedules approved by the Administrator. Chemical speciation is encouraged at additional sites where the chemically resolved data would be useful in developing State implementation plans and supporting atmospheric or health effects related studies.
4.8 Coarse Particulate Matter (PM10-2.5) Design Criteria.
4.8.1 General Monitoring Requirements. (a) The only required monitors for PM10-2.5 are those required at NCore Stations.
(b) Although microscale monitoring may be appropriate in some circumstances, middle and neighborhood scale measurements are the most important station classifications for PM10-2.5 to assess the variation in coarse particle concentrations that would be expected across populated areas that are in proximity to large emissions sources.
(1) Microscale —This scale would typify relatively small areas immediately adjacent to: Industrial sources; locations experiencing ongoing construction, redevelopment, and soil disturbance; and heavily traveled roadways. Data collected at microscale stations would characterize exposure over areas of limited spatial extent and population exposure, and may provide information useful for evaluating and developing source-oriented control measures.
(2) Middle scale —People living or working near major roadways or industrial districts encounter particle concentrations that would be adequately characterized by this spatial scale. Thus, measurements of this type would be appropriate for the evaluation of public health effects of coarse particle exposure. Monitors located in populated areas that are nearly adjacent to large industrial point sources of coarse particles provide suitable locations for assessing maximum population exposure levels and identifying areas of potentially poor air quality. Similarly, monitors located in populated areas that border dense networks of heavily-traveled traffic are appropriate for assessing the impacts of resuspended road dust. This scale also includes the characteristic concentrations for other areas with dimensions of a few hundred meters such as school grounds and parks that are nearly adjacent to major roadways and industrial point sources, locations exhibiting mixed residential and commercial development, and downtown areas featuring office buildings, shopping centers, and stadiums.
(3) Neighborhood scale —Measurements in this category would represent conditions throughout some reasonably homogeneous urban sub-region with dimensions of a few kilometers and of generally more regular shape than the middle scale. Homogeneity refers to the particulate matter concentrations, as well as the land use and land surface characteristics. This category includes suburban neighborhoods dominated by residences that are somewhat distant from major roadways and industrial districts but still impacted by urban sources, and areas of diverse land use where residences are interspersed with commercial and industrial neighborhoods. In some cases, a location carefully chosen to provide neighborhood scale data would represent the immediate neighborhood as well as neighborhoods of the same type in other parts of the city. The comparison of data from middle scale and neighborhood scale sites would provide valuable information for determining the variation of PM10-2.5 levels across urban areas and assessing the spatial extent of elevated concentrations caused by major industrial point sources and heavily traveled roadways. Neighborhood scale sites would provide concentration data that are relevant to informing a large segment of the population of their exposure levels on a given day.
4.8.2 [Reserved]
5. Network Design for Photochemical Assessment Monitoring Stations (PAMS) and Enhanced Ozone Monitoring
(a) State and local monitoring agencies are required to collect and report PAMS measurements at each NCore site required under paragraph 3(a) of this appendix located in a CBSA with a population of 1,000,000 or more, based on the latest available census figures.
(b) PAMS measurements include:
(1) Hourly averaged speciated volatile organic compounds (VOCs);
(2) Three 8-hour averaged carbonyl samples per day on a 1 in 3 day schedule, or hourly averaged formaldehyde;
(3) Hourly averaged O3;
(4) Hourly averaged nitrogen oxide (NO), true nitrogen dioxide (NO2), and total reactive nitrogen (NOy);
(5) Hourly averaged ambient temperature;
(6) Hourly vector-averaged wind direction;
(7) Hourly vector-averaged wind speed;
(8) Hourly average atmospheric pressure;
(9) Hourly averaged relative humidity;
(10) Hourly precipitation;
(11) Hourly averaged mixing-height;
(12) Hourly averaged solar radiation; and
(13) Hourly averaged ultraviolet radiation.
(c) The EPA Regional Administrator may grant a waiver to allow the collection of required PAMS measurements at an alternative location where the monitoring agency can demonstrate that the alternative location will provide representative data useful for regional or national scale modeling and the tracking of trends in O3 precursors. The alternative location can be outside of the CBSA or outside of the monitoring agencies jurisdiction. In cases where the alternative location crosses jurisdictions the waiver will be contingent on the monitoring agency responsible for the alternative location including the required PAMS measurements in their annual monitoring plan required under § 58.10 and continued successful collection of PAMS measurements at the alternative location. This waiver can be revoked in cases where the Regional Administrator determines the PAMS measurements are not being collected at the alternate location in compliance with paragraph (b) of this section.
(d) The EPA Regional Administrator may grant a waiver to allow speciated VOC measurements to be made as three 8-hour averages on every third day during the PAMS season as an alternative to 1-hour average speciated VOC measurements in cases where the primary VOC compounds are not well measured using continuous technology due to low detectability of the primary VOC compounds or for logistical and other programmatic constraints.
(e) The EPA Regional Administrator may grant a waiver to allow representative meteorological data from nearby monitoring stations to be used to meet the meteorological requirements in paragraph 5(b) where the monitoring agency can demonstrate the data is collected in a manner consistent with EPA quality assurance requirements for these measurements.
(f) The EPA Regional Administrator may grant a waiver from the requirement to collect PAMS measurements in locations where CBSA-wide O3 design values are equal to or less than 85% of the 8-hour O3 NAAQS and where the location is not considered by the Regional Administrator to be an important upwind or downwind location for other O3 nonattainment areas.
(g) At a minimum, the monitoring agency shall collect the required PAMS measurements during the months of June, July, and August.
(h) States with Moderate and above 8-hour O3 nonattainment areas and states in the Ozone Transport Region as defined in 40 CFR 51.900 shall develop and implement an Enhanced Monitoring Plan (EMP) detailing enhanced O3 and O3 precursor monitoring activities to be performed. The EMP shall be submitted to the EPA Regional Administrator no later than October 1, 2019 or two years following the effective date of a designation to a classification of Moderate or above O3 nonattainment, whichever is later. At a minimum, the EMP shall be reassessed and approved as part of the 5-year network assessments required under 40 CFR 58.10(d). The EMP will include monitoring activities deemed important to understanding the O3 problems in the state. Such activities may include, but are not limited to, the following:
(1) Additional O3 monitors beyond the minimally required under paragraph 4.1 of this appendix,
(2) Additional NOX or NOy monitors beyond those required under 4.3 of this appendix,
(3) Additional speciated VOC measurements including data gathered during different periods other than required under paragraph 5(g) of this appendix, or locations other than those required under paragraph 5(a) of this appendix, and
(4) Enhanced upper air measurements of meteorology or pollution concentrations.
6. References
1. Ball, R.J. and G.E. Anderson. Optimum Site Exposure Criteria for SO2 Monitoring. The Center for the Environment and Man, Inc., Hartford, CT. Prepared for U.S. Environmental Protection Agency, Research Triangle Park, NC. EPA Publication No. EPA-450/3-77-013. April 1977.
2. Ludwig, F.F., J.H.S. Kealoha, and E. Shelar. Selecting Sites for Carbon Monoxide Monitoring. Stanford Research Institute, Menlo Park, CA. Prepared for U.S. Environmental Protection Agency, Research Triangle Park, NC. EPA Publication No. EPA-450/3-75-077, September 1975.
3. Air Quality Criteria for Lead. Office of Research and Development, U.S. Environmental Protection Agency, Washington D.C. EPA Publication No. 600/8-89-049F. August 1990. (NTIS document numbers PB87-142378 and PB91-138420.)
4. Optimum Site Exposure Criteria for Lead Monitoring. PEDCo Environmental, Inc. Cincinnati, OH. Prepared for U.S. Environmental Protection Agency, Research Triangle Park, NC. EPA Contract No. 68-02-3013. May 1981.
5. Guidance for Conducting Ambient Air Monitoring for Lead Around Point Sources. Office of Air Quality Planning and Standards, U.S. Environmental Protection Agency, Research Triangle Park, NC. EPA-454/R-92-009. May 1997.
6. Koch, R.C. and H.E. Rector. Optimum Network Design and Site Exposure Criteria for Particulate Matter. GEOMET Technologies, Inc., Rockville, MD. Prepared for U.S. Environmental Protection Agency, Research Triangle Park, NC. EPA Contract No. 68-02-3584. EPA 450/4-87-009. May 1987.
7. Watson et al. Guidance for Network Design and Optimum Site Exposure for PM2.5 and PM10. Prepared for U.S. Environmental Protection Agency, Research Triangle Park, NC. EPA-454/R-99-022, December 1997.
8. Guideline for Selecting and Modifying the Ozone Monitoring Season Based on an 8-Hour Ozone Standard. Prepared for U.S. Environmental Protection Agency, RTP, NC. EPA-454/R-98-001, June 1998.
9. Photochemical Assessment Monitoring Stations Implementation Manual. Office of Air Quality Planning and Standards, U.S. Environmental Protection Agency, Research Triangle Park, NC. EPA-454/B-93-051. March 1994.
[71 FR 61316, Oct. 17, 2006, as amended at 72 FR 32211, June 12, 2007; 73 FR 67062, Nov. 12, 2008; 75 FR 6534, Feb. 9, 2010; 75 FR 35602, June 22, 2010; 75 FR 81137, Dec. 27, 2010; 76 FR 54342, Aug. 31, 2011; 78 FR 3284, Jan. 15, 2013; 80 FR 65466, Oct. 26, 2015; 81 FR 17298, Mar. 28, 2016; 81 FR 96388, Dec. 30, 2016]
Appendix E to Part 58—Probe and Monitoring Path Siting Criteria for Ambient Air Quality Monitoring
1. Introduction.
2. Horizontal and Vertical Placement.
3. Spacing from Minor Sources.
4. Spacing From Obstructions.
5. Spacing From Trees.
6. Spacing From Roadways.
7. Cumulative Interferences on a Monitoring Path.
8. Maximum Monitoring Path Length.
9. Probe Material and Pollutant Sample Residence Time.
10. Waiver Provisions.
11. Summary.
12. References.
1. Introduction
(a) This appendix contains specific location criteria applicable to SLAMS, NCore, and PAMS ambient air quality monitoring probes, inlets, and optical paths after the general location has been selected based on the monitoring objectives and spatial scale of representation discussed in appendix D to this part. Adherence to these siting criteria is necessary to ensure the uniform collection of compatible and comparable air quality data.
(b) The probe and monitoring path siting criteria discussed in this appendix must be followed to the maximum extent possible. It is recognized that there may be situations where some deviation from the siting criteria may be necessary. In any such case, the reasons must be thoroughly documented in a written request for a waiver that describes how and why the proposed siting deviates from the criteria. This documentation should help to avoid later questions about the validity of the resulting monitoring data. Conditions under which the EPA would consider an application for waiver from these siting criteria are discussed in section 10 of this appendix.
(c) The pollutant-specific probe and monitoring path siting criteria generally apply to all spatial scales except where noted otherwise. Specific siting criteria that are phrased with a “must” are defined as requirements and exceptions must be approved through the waiver provisions. However, siting criteria that are phrased with a “should” are defined as goals to meet for consistency but are not requirements.
2. Horizontal and Vertical Placement
The probe or at least 80 percent of the monitoring path must be located between 2 and 15 meters above ground level for all O3 and SO2 monitoring sites, and for neighborhood or larger spatial scale Pb, PM10, PM10-2.5, PM2.5, NO2, and CO sites. Middle scale PM10-2.5 sites are required to have sampler inlets between 2 and 7 meters above ground level. Microscale Pb, PM10, PM10-2.5, and PM2.5 sites are required to have sampler inlets between 2 and 7 meters above ground level. Microscale near-road NO2 monitoring sites are required to have sampler inlets between 2 and 7 meters above ground level. The inlet probes for microscale carbon monoxide monitors that are being used to measure concentrations near roadways must be between 2 and 7 meters above ground level. Those inlet probes for microscale carbon monoxide monitors measuring concentrations near roadways in downtown areas or urban street canyons must be between 2.5 and 3.5 meters above ground level. The probe or at least 90 percent of the monitoring path must be at least 1 meter vertically or horizontally away from any supporting structure, walls, parapets, penthouses, etc., and away from dusty or dirty areas. If the probe or a significant portion of the monitoring path is located near the side of a building or wall, then it should be located on the windward side of the building relative to the prevailing wind direction during the season of highest concentration potential for the pollutant being measured.
3. Spacing From Minor Sources
(a) It is important to understand the monitoring objective for a particular location in order to interpret this particular requirement. Local minor sources of a primary pollutant, such as SO2, lead, or particles, can cause high concentrations of that particular pollutant at a monitoring site. If the objective for that monitoring site is to investigate these local primary pollutant emissions, then the site is likely to be properly located nearby. This type of monitoring site would in all likelihood be a microscale type of monitoring site. If a monitoring site is to be used to determine air quality over a much larger area, such as a neighborhood or city, a monitoring agency should avoid placing a monitor probe, path, or inlet near local, minor sources. The plume from the local minor sources should not be allowed to inappropriately impact the air quality data collected at a site. Particulate matter sites should not be located in an unpaved area unless there is vegetative ground cover year round, so that the impact of wind blown dusts will be kept to a minimum.
(b) Similarly, local sources of nitric oxide (NO) and ozone-reactive hydrocarbons can have a scavenging effect causing unrepresentatively low concentrations of O3 in the vicinity of probes and monitoring paths for O3. To minimize these potential interferences, the probe or at least 90 percent of the monitoring path must be away from furnace or incineration flues or other minor sources of SO2 or NO. The separation distance should take into account the heights of the flues, type of waste or fuel burned, and the sulfur content of the fuel.
4. Spacing From Obstructions
(a) Buildings and other obstacles may possibly scavenge SO2, O3, or NO2, and can act to restrict airflow for any pollutant. To avoid this interference, the probe, inlet, or at least 90 percent of the monitoring path must have unrestricted airflow and be located away from obstacles. The distance from the obstacle to the probe, inlet, or monitoring path must be at least twice the height that the obstacle protrudes above the probe, inlet, or monitoring path. An exception to this requirement can be made for measurements taken in street canyons or at source-oriented sites where buildings and other structures are unavoidable.
(b) Generally, a probe or monitoring path located near or along a vertical wall is undesirable because air moving along the wall may be subject to possible removal mechanisms. A probe, inlet, or monitoring path must have unrestricted airflow in an arc of at least 180 degrees. This arc must include the predominant wind direction for the season of greatest pollutant concentration potential. For particle sampling, a minimum of 2 meters of separation from walls, parapets, and structures is required for rooftop site placement.
(c) Special consideration must be given to the use of open path analyzers due to their inherent potential sensitivity to certain types of interferences, or optical obstructions. A monitoring path must be clear of all trees, brush, buildings, plumes, dust, or other optical obstructions, including potential obstructions that may move due to wind, human activity, growth of vegetation, etc. Temporary optical obstructions, such as rain, particles, fog, or snow, should be considered when siting an open path analyzer. Any of these temporary obstructions that are of sufficient density to obscure the light beam will affect the ability of the open path analyzer to continuously measure pollutant concentrations. Transient, but significant obscuration of especially longer measurement paths could occur as a result of certain meteorological conditions (e.g., heavy fog, rain, snow) and/or aerosol levels that are of a sufficient density to prevent the open path analyzer's light transmission. If certain compensating measures are not otherwise implemented at the onset of monitoring (e.g., shorter path lengths, higher light source intensity), data recovery during periods of greatest primary pollutant potential could be compromised. For instance, if heavy fog or high particulate levels are coincident with periods of projected NAAQS-threatening pollutant potential, the representativeness of the resulting data record in reflecting maximum pollutant concentrations may be substantially impaired despite the fact that the site may otherwise exhibit an acceptable, even exceedingly high overall valid data capture rate.
(d) For near-road NO2 monitoring stations, the monitor probe shall have an unobstructed air flow, where no obstacles exist at or above the height of the monitor probe, between the monitor probe and the outside nearest edge of the traffic lanes of the target road segment.
5. Spacing From Trees
(a) Trees can provide surfaces for SO2, O3, or NO2 adsorption or reactions, and surfaces for particle deposition. Trees can also act as obstructions in cases where they are located between the air pollutant sources or source areas and the monitoring site, and where the trees are of a sufficient height and leaf canopy density to interfere with the normal airflow around the probe, inlet, or monitoring path. To reduce this possible interference/obstruction, the probe, inlet, or at least 90 percent of the monitoring path must be at least 10 meters or further from the drip line of trees.
(b) The scavenging effect of trees is greater for O3 than for other criteria pollutants. Monitoring agencies must take steps to consider the impact of trees on ozone monitoring sites and take steps to avoid this problem.
(c) For microscale sites of any air pollutant, no trees or shrubs should be located between the probe and the source under investigation, such as a roadway or a stationary source.
6. Spacing From Roadways
Table E-1 of Appendix E to Part 58—Minimum Separation Distance Between Roadways and Probes or Monitoring Paths for Monitoring Neighborhood and Urban Scale Ozone (O3) and Oxides of Nitrogen (NO, NO2, NOX, NOy)
| Roadway
average daily traffic, vehicles per day |
Minimum
distance1 (meters) |
Minimum
distance1 2 (meters) |
|---|---|---|
| ≤1,000 | 10 | 10 |
| 10,000 | 10 | 20 |
| 15,000 | 20 | 30 |
| 20,000 | 30 | 40 |
| 40,000 | 50 | 60 |
| 70,000 | 100 | 100 |
| ≥110,000 | 250 | 250 |
6.1 Spacing for Ozone Probes and Monitoring Paths
In siting an O3 analyzer, it is important to minimize destructive interferences form sources of NO, since NO readily reacts with O3. Table E-1 of this appendix provides the required minimum separation distances between a roadway and a probe or, where applicable, at least 90 percent of a monitoring path for various ranges of daily roadway traffic. A sampling site having a point analyzer probe located closer to a roadway than allowed by the Table E-1 requirements should be classified as microscale or middle scale, rather than neighborhood or urban scale, since the measurements from such a site would more closely represent the middle scale. If an open path analyzer is used at a site, the monitoring path(s) must not cross over a roadway with an average daily traffic count of 10,000 vehicles per day or more. For those situations where a monitoring path crosses a roadway with fewer than 10,000 vehicles per day, monitoring agencies must consider the entire segment of the monitoring path in the area of potential atmospheric interference from automobile emissions. Therefore, this calculation must include the length of the monitoring path over the roadway plus any segments of the monitoring path that lie in the area between the roadway and minimum separation distance, as determined from the Table E-1 of this appendix. The sum of these distances must not be greater than 10 percent of the total monitoring path length.
6.2 Spacing for Carbon Monoxide Probes and Monitoring Paths.
(a) Near-road microscale CO monitoring sites, including those located in downtown areas, urban street canyons, and other near-road locations such as those adjacent to highly trafficked roads, are intended to provide a measurement of the influence of the immediate source on the pollution exposure on the adjacent area.
(b) Microscale CO monitor inlets probes in downtown areas or urban street canyon locations shall be located a minimum distance of 2 meters and a maximum distance of 10 meters from the edge of the nearest traffic lane.
(c) Microscale CO monitor inlet probes in downtown areas or urban street canyon locations shall be located at least 10 meters from an intersection and preferably at a midblock location. Midblock locations are preferable to intersection locations because intersections represent a much smaller portion of downtown space than do the streets between them. Pedestrian exposure is probably also greater in street canyon/corridors than at intersections.
Table E-2 of Appendix E to Part 58—Minimum Separation Distance Between Roadways and Probes or Monitoring Paths for Monitoring Neighborhood Scale Carbon Monoxide
| Roadway average daily traffic, vehicles per day | Minimum distance1 (meters) |
|---|---|
| ≤10,000 | 10 |
| 15,000 | 25 |
| 20,000 | 45 |
| 30,000 | 80 |
| 40,000 | 115 |
| 50,000 | 135 |
| ≥60,000 | 150 |
6.3 Spacing for Particulate Matter (PM2.5, PM10, Pb) Inlets.
(a) Since emissions associated with the operation of motor vehicles contribute to urban area particulate matter ambient levels, spacing from roadway criteria are necessary for ensuring national consistency in PM sampler siting.
(b) The intent is to locate localized hot-spot sites in areas of highest concentrations whether it be from mobile or multiple stationary sources. If the area is primarily affected by mobile sources and the maximum concentration area(s) is judged to be a traffic corridor or street canyon location, then the monitors should be located near roadways with the highest traffic volume and at separation distances most likely to produce the highest concentrations. For the microscale traffic corridor site, the location must be between 5 and 15 meters from the major roadway. For the microscale street canyon site the location must be between 2 and 10 meters from the roadway. For the middle scale site, a range of acceptable distances from the roadway is shown in figure E-1 of this appendix. This figure also includes separation distances between a roadway and neighborhood or larger scale sites by default. Any site, 2 to 15 meters high, and further back than the middle scale requirements will generally be neighborhood, urban or regional scale. For example, according to Figure E-1 of this appendix, if a PM sampler is primarily influenced by roadway emissions and that sampler is set back 10 meters from a 30,000 ADT (average daily traffic) road, the site should be classified as microscale, if the sampler height is between 2 and 7 meters. If the sampler height is between 7 and 15 meters, the site should be classified as middle scale. If the sample is 20 meters from the same road, it will be classified as middle scale; if 40 meters, neighborhood scale; and if 110 meters, an urban scale.
6.4 Spacing for Nitrogen Dioxide (NO2) Probes and Monitoring Paths.
(a) In siting near-road NO2 monitors as required in paragraph 4.3.2 of appendix D of this part, the monitor probe shall be as near as practicable to the outside nearest edge of the traffic lanes of the target road segment; but shall not be located at a distance greater than 50 meters, in the horizontal, from the outside nearest edge of the traffic lanes of the target road segment.
(b) In siting NO2 monitors for neighborhood and larger scale monitoring, it is important to minimize near-road influences. Table E-1 of this appendix provides the required minimum separation distances between a roadway and a probe or, where applicable, at least 90 percent of a monitoring path for various ranges of daily roadway traffic. A sampling site having a point analyzer probe located closer to a roadway than allowed by the Table E-1 requirements should be classified as microscale or middle scale rather than neighborhood or urban scale. If an open path analyzer is used at a site, the monitoring path(s) must not cross over a roadway with an average daily traffic count of 10,000 vehicles per day or more. For those situations where a monitoring path crosses a roadway with fewer than 10,000 vehicles per day, monitoring agencies must consider the entire segment of the monitoring path in the area of potential atmospheric interference form automobile emissions. Therefore, this calculation must include the length of the monitoring path over the roadway plus any segments of the monitoring path that lie in the area between the roadway and minimum separation distance, as determined form the Table E-1 of this appendix. The sum of these distances must not be greater than 10 percent of the total monitoring path length.

7. Cumulative Interferences on a Monitoring Path
(This paragraph applies only to open path analyzers.) The cumulative length or portion of a monitoring path that is affected by minor sources, trees, or roadways must not exceed 10 percent of the total monitoring path length.
8. Maximum Monitoring Path Length
(This paragraph applies only to open path analyzers.) The monitoring path length must not exceed 1 kilometer for analyzers in neighborhood, urban, or regional scale. For middle scale monitoring sites, the monitoring path length must not exceed 300 meters. In areas subject to frequent periods of dust, fog, rain, or snow, consideration should be given to a shortened monitoring path length to minimize loss of monitoring data due to these temporary optical obstructions. For certain ambient air monitoring scenarios using open path analyzers, shorter path lengths may be needed in order to ensure that the monitoring site meets the objectives and spatial scales defined in appendix D to this part. The Regional Administrator may require shorter path lengths, as needed on an individual basis, to ensure that the SLAMS sites meet the appendix D requirements. Likewise, the Administrator may specify the maximum path length used at NCore monitoring sites.
9. Probe Material and Pollutant Sample Residence Time
(a) For the reactive gases, SO2, NO2, and O3, special probe material must be used for point analyzers. Studies20-24 have been conducted to determine the suitability of materials such as polypropylene, polyethylene, polyvinyl chloride, Tygon ®, aluminum, brass, stainless steel, copper, Pyrex ® glass and Teflon ® for use as intake sampling lines. Of the above materials, only Pyrex ® glass and Teflon ® have been found to be acceptable for use as intake sampling lines for all the reactive gaseous pollutants. Furthermore, the EPA25 has specified borosilicate glass or FEP Teflon ® as the only acceptable probe materials for delivering test atmospheres in the determination of reference or equivalent methods. Therefore, borosilicate glass, FEP Teflon ® or their equivalent must be the only material in the sampling train (from inlet probe to the back of the analyzer) that can be in contact with the ambient air sample for existing and new SLAMs.
(b) For volatile organic compound (VOC) monitoring at PAMS, FEP Teflon ® is unacceptable as the probe material because of VOC adsorption and desorption reactions on the FEP Teflon ®. Borosilicate glass, stainless steel, or its equivalent are the acceptable probe materials for VOC and carbonyl sampling. Care must be taken to ensure that the sample residence time is kept to 20 seconds or less.
(c) No matter how nonreactive the sampling probe material is initially, after a period of use reactive particulate matter is deposited on the probe walls. Therefore, the time it takes the gas to transfer from the probe inlet to the sampling device is also critical. Ozone in the presence of nitrogen oxide (NO) will show significant losses even in the most inert probe material when the residence time exceeds 20 seconds.26 Other studies27 28 indicate that a 10 second or less residence time is easily achievable. Therefore, sampling probes for reactive gas monitors at NCore and at NO2 sites must have a sample residence time less than 20 seconds.
10. Waiver Provisions
Most sampling probes or monitors can be located so that they meet the requirements of this appendix. New sites with rare exceptions, can be located within the limits of this appendix. However, some existing sites may not meet these requirements and still produce useful data for some purposes. The EPA will consider a written request from the State agency to waive one or more siting criteria for some monitoring sites providing that the State can adequately demonstrate the need (purpose) for monitoring or establishing a monitoring site at that location.
10.1 For establishing a new site, a waiver may be granted only if both of the following criteria are met:
10.1.1 The site can be demonstrated to be as representative of the monitoring area as it would be if the siting criteria were being met.
10.1.2 The monitor or probe cannot reasonably be located so as to meet the siting criteria because of physical constraints (e.g., inability to locate the required type of site the necessary distance from roadways or obstructions).
10.2 However, for an existing site, a waiver may be granted if either of the criteria in sections 10.1.1 and 10.1.2 of this appendix are met.
10.3 Cost benefits, historical trends, and other factors may be used to add support to the criteria in sections 10.1.1 and 10.1.2 of this appendix, however, they in themselves, will not be acceptable reasons for granting a waiver. Written requests for waivers must be submitted to the Regional Administrator.
11. Summary
Table E-4 of this appendix presents a summary of the general requirements for probe and monitoring path siting criteria with respect to distances and heights. It is apparent from Table E-4 that different elevation distances above the ground are shown for the various pollutants. The discussion in this appendix for each of the pollutants describes reasons for elevating the monitor, probe, or monitoring path. The differences in the specified range of heights are based on the vertical concentration gradients. For CO and near-road NO2 monitors, the gradients in the vertical direction are very large for the microscale, so a small range of heights are used. The upper limit of 15 meters is specified for the consistency between pollutants and to allow the use of a single manifold or monitoring path for monitoring more than one pollutant.
Table E-4 of Appendix E to Part 58—Summary of Probe and Monitoring Path Siting Criteria
| Pollutant | Scale (maximum monitoring path length, meters) | Height from ground to probe, inlet or 80% of monitoring path1 (meters) | Horizontal and vertical distance from supporting structures2 to probe, inlet or 90% of monitoring path1 (meters) | Distance from trees to probe, inlet or 90% of monitoring path1 (meters) | Distance from roadways to probe, inlet or monitoring path1 (meters) |
|---|---|---|---|---|---|
| SO23 4 5 6 | Middle (300 m) Neighborhood Urban, and Regional (1 km) | 2-15 | >1 | >10 | N/A. |
| CO4 5 7 | Micro [downtown or street canyon sites], micro [near-road sites], middle (300 m) and Neighborhood (1 km) | 2.5-3.5; 2-7; 2-15 | >1 | >10 | 2-10 for downtown areas or street canyon microscale; ≤50 for near-road microscale; see Table E-2 of this appendix for middle and neighborhood scales. |
| O33 4 5 | Middle (300 m) Neighborhood, Urban, and Regional (1 km) | 2-15 | >1 | >10 | See Table E-1 of this appendix for all scales. |
| NO23 4 5 | Micro (Near-road [50-300 m]) | 2-7 (micro); | >1 | >10 | ≤50 for near-road micro-scale. |
| Middle (300 m) | 2-15 (all other scales) | ||||
| Neighborhood, Urban, and Regional (1 km) | See Table E-1 of this appendix for all other scales. | ||||
| Ozone precursors (for PAMS)3 4 5 | Neighborhood and Urban (1 km) | 2-15 | >1 | >10 | See Table E-4 of this appendix for all scales. |
| PM, Pb3 4 5 8 | Micro, Middle, Neighborhood, Urban and Regional | 2-7 (micro); 2-7 (middle PM10-2.5); 2-7 for near-road; 2-15 (all other scales) | >2 (all scales, horizontal distance only) | >10 (all scales) | 2-10 (micro); see Figure E-1 of this appendix for all other scales. ≤50 for near-road. |
12. References
1. Bryan, R.J., R.J. Gordon, and H. Menck. Comparison of High Volume Air Filter Samples at Varying Distances from Los Angeles Freeway. University of Southern California, School of Medicine, Los Angeles, CA. (Presented at 66th Annual Meeting of Air Pollution Control Association. Chicago, IL. June 24-28, 1973. APCA 73-158.)
2. Teer, E.H. Atmospheric Lead Concentration Above an Urban Street. Master of Science Thesis, Washington University, St. Louis, MO. January 1971.
3. Bradway, R.M., F.A. Record, and W.E. Belanger. Monitoring and Modeling of Resuspended Roadway Dust Near Urban Arterials. GCA Technology Division, Bedford, MA. (Presented at 1978 Annual Meeting of Transportation Research Board, Washington, DC. January 1978.)
4. Pace, T.G., W.P. Freas, and E.M. Afify. Quantification of Relationship Between Monitor Height and Measured Particulate Levels in Seven U.S. Urban Areas. U.S. Environmental Protection Agency, Research Triangle Park, NC. (Presented at 70th Annual Meeting of Air Pollution Control Association, Toronto, Canada. June 20-24, 1977. APCA 77-13.4.)
5. Harrison, P.R. Considerations for Siting Air Quality Monitors in Urban Areas. City of Chicago, Department of Environmental Control, Chicago, IL. (Presented at 66th Annual Meeting of Air Pollution Control Association, Chicago, IL. June 24-28, 1973. APCA 73-161.)
6. Study of Suspended Particulate Measurements at Varying Heights Above Ground. Texas State Department of Health, Air Control Section, Austin, TX. 1970. p.7.
7. Rodes, C.E. and G.F. Evans. Summary of LACS Integrated Pollutant Data. In: Los Angeles Catalyst Study Symposium. U.S. Environmental Protection Agency, Research Triangle Park, NC. EPA Publication No. EPA-600/4-77-034. June 1977.
8. Lynn, D.A. et al. National Assessment of the Urban Particulate Problem: Volume 1, National Assessment. GCA Technology Division, Bedford, MA. U.S. Environmental Protection Agency, Research Triangle Park, NC. EPA Publication No. EPA-450/3-75-024. June 1976.
9. Pace, T.G. Impact of Vehicle-Related Particulates on TSP Concentrations and Rationale for Siting Hi-Vols in the Vicinity of Roadways. OAQPS, U.S. Environmental Protection Agency, Research Triangle Park, NC. April 1978.
10. Ludwig, F.L., J.H. Kealoha, and E. Shelar. Selecting Sites for Monitoring Total Suspended Particulates. Stanford Research Institute, Menlo Park, CA. Prepared for U.S. Environmental Protection Agency, Research Triangle Park, NC. EPA Publication No. EPA-450/3-77-018. June 1977, revised December 1977.
11. Ball, R.J. and G.E. Anderson. Optimum Site Exposure Criteria for SO2 Monitoring. The Center for the Environment and Man, Inc., Hartford, CT. Prepared for U.S. Environmental Protection Agency, Research Triangle Park, NC. EPA Publication No. EPA-450/3-77-013. April 1977.
12. Ludwig, F.L. and J.H.S. Kealoha. Selecting Sites for Carbon Monoxide Monitoring. Stanford Research Institute, Menlo Park, CA. Prepared for U.S. Environmental Protection Agency, Research Triangle Park, NC. EPA Publication No. EPA-450/3-75-077. September 1975.
13. Ludwig, F.L. and E. Shelar. Site Selection for the Monitoring of Photochemical Air Pollutants. Stanford Research Institute, Menlo Park, CA. Prepared for U.S. Environmental Protection Agency, Research Triangle Park, NC. EPA Publication No. EPA-450/3-78-013. April 1978.
14. Lead Analysis for Kansas City and Cincinnati, PEDCo Environmental, Inc., Cincinnati, OH. Prepared for U.S. Environmental Protection Agency, Research Triangle Park, NC. EPA Contract No. 66-02-2515, June 1977.
15. Barltrap, D. and C.D. Strelow. Westway Nursery Testing Project. Report to the Greater London Council. August 1976.
16. Daines, R. H., H. Moto, and D. M. Chilko. Atmospheric Lead: Its Relationship to Traffic Volume and Proximity to Highways. Environ. Sci. and Technol., 4:318, 1970.
17. Johnson, D. E., et al. Epidemiologic Study of the Effects of Automobile Traffic on Blood Lead Levels, Southwest Research Institute, Houston, TX. Prepared for U.S. Environmental Protection Agency, Research Triangle Park, NC. EPA-600/1-78-055, August 1978.
18. Air Quality Criteria for Lead. Office of Research and Development, U.S. Environmental Protection Agency, Washington, DC EPA-600/8-83-028 aF-dF, 1986, and supplements EPA-600/8-89/049F, August 1990. (NTIS document numbers PB87-142378 and PB91-138420.)
19. Lyman, D. R. The Atmospheric Diffusion of Carbon Monoxide and Lead from an Expressway, Ph.D. Dissertation, University of Cincinnati, Cincinnati, OH. 1972.
20. Wechter, S.G. Preparation of Stable Pollutant Gas Standards Using Treated Aluminum Cylinders. ASTM STP. 598:40-54, 1976.
21. Wohlers, H.C., H. Newstein and D. Daunis. Carbon Monoxide and Sulfur Dioxide Adsorption On and Description From Glass, Plastic and Metal Tubings. J. Air Poll. Con. Assoc. 17:753, 1976.
22. Elfers, L.A. Field Operating Guide for Automated Air Monitoring Equipment. U.S. NTIS. p. 202, 249, 1971.
23. Hughes, E.E. Development of Standard Reference Material for Air Quality Measurement. ISA Transactions, 14:281-291, 1975.
24. Altshuller, A.D. and A.G. Wartburg. The Interaction of Ozone with Plastic and Metallic Materials in a Dynamic Flow System. Intern. Jour. Air and Water Poll., 4:70-78, 1961.
25. Code of Federal Regulations. Title 40 part 53.22, July 1976.
26. Butcher, S.S. and R.E. Ruff. Effect of Inlet Residence Time on Analysis of Atmospheric Nitrogen Oxides and Ozone, Anal. Chem., 43:1890, 1971.
27. Slowik, A.A. and E.B. Sansone. Diffusion Losses of Sulfur Dioxide in Sampling Manifolds. J. Air. Poll. Con. Assoc., 24:245, 1974.
28. Yamada, V.M. and R.J. Charlson. Proper Sizing of the Sampling Inlet Line for a Continuous Air Monitoring Station. Environ. Sci. and Technol., 3:483, 1969.
29. Koch, R.C. and H.E. Rector. Optimum Network Design and Site Exposure Criteria for Particulate Matter, GEOMET Technologies, Inc., Rockville, MD. Prepared for U.S. Environmental Protection Agency, Research Triangle Park, NC. EPA Contract No. 68-02-3584. EPA 450/4-87-009. May 1987.
30. Burton, R.M. and J.C. Suggs. Philadelphia Roadway Study. Environmental Monitoring Systems Laboratory, U.S. Environmental Protection Agency, Research Triangle Park, N.C. EPA-600/4-84-070 September 1984.
31. Technical Assistance Document For Sampling and Analysis of Ozone Precursors. Atmospheric Research and Exposure Assessment Laboratory, U.S. Environmental Protection Agency, Research Triangle Park, NC 27711. EPA 600/8-91-215. October 1991.
32. Quality Assurance Handbook for Air Pollution Measurement Systems: Volume IV. Meteorological Measurements. Atmospheric Research and Exposure Assessment Laboratory, U.S. Environmental Protection Agency, Research Triangle Park, NC 27711. EPA 600/4-90-0003. August 1989.
33. On-Site Meteorological Program Guidance for Regulatory Modeling Applications. Office of Air Quality Planning and Standards, U.S. Environmental Protection Agency, Research Triangle Park, NC 27711. EPA 450/4-87-013. June 1987F.
[71 FR 61323, Oct. 17, 2006, as amended at 75 FR 6535, Feb. 9, 2010; 76 FR 54342, Aug. 31, 2011; 78 FR 3285, Jan. 15, 2013]
Appendix F to Part 58 [Reserved]
Appendix G to Part 58—Uniform Air Quality Index (AQI) and Daily Reporting
General Requirements
1. What is the AQI?
2. Why report the AQI?
3. Must I report the AQI?
4. What goes into my AQI report?
5. Is my AQI report for my MSA only?
6. How do I get my AQI report to the public?
7. How often must I report the AQI?
8. May I make exceptions to these reporting requirements?
Calculation
9. How Does the AQI Relate to Air Pollution Levels?
10. What Monitors Should I Use To Get the Pollutant Concentrations for Calculating the AQI?
11. Do I have to forecast the AQI?
12. How Do I Calculate the AQI?
Background and Reference Materials
13. What Additional Information Should I Know?
General Requirements
1. What Is the AQI?
The AQI is a tool that simplifies reporting air quality to the general public. The AQI incorporates into a single index concentrations of 5 criteria pollutants: ozone (O3), particulate matter (PM), carbon monoxide (CO), sulfur dioxide (SO2), and nitrogen dioxide (NO2). The scale of the index is divided into general categories that are associated with health messages.
2. Why Report the AQI?
The AQI offers various advantages:
a. It is simple to create and understand.
b. It conveys the health implications of air quality.
c. It promotes uniform use throughout the country.
3. Must I Report the AQI?
You must report the AQI daily if yours is a metropolitan statistical area (MSA) with a population over 350,000.
4. What Goes Into My AQI Report?
i. Your AQI report must contain the following:
a. The reporting area(s) (the MSA or subdivision of the MSA).
b. The reporting period (the day for which the AQI is reported).
c. The critical pollutant (the pollutant with the highest index value).
d. The AQI (the highest index value).
e. The category descriptor and index value associated with the AQI and, if you choose to report in a color format, the associated color. Use only the following descriptors and colors for the six AQI categories:
Table 1—AQI Categories
| For this AQI | Use this descriptor | And this color1 |
|---|---|---|
| 0 to 50 | “Good” | Green. |
| 51 to 100 | “Moderate” | Yellow. |
| 101 to 150 | “Unhealthy for Sensitive Groups” | Orange. |
| 151 to 200 | “Unhealthy” | Red. |
| 201 to 300 | “Very Unhealthy” | Purple. |
| 301 and above | “Hazardous” | Maroon.1 |
f. The pollutant specific sensitive groups for any reported index value greater than 100. Use the following sensitive groups for each pollutant:
| When this pollutant has an index value above 100 * * * | Report these sensitive groups * * * |
|---|---|
| Ozone | Children and people with asthma are the groups most at risk. |
| PM2.5 | People with respiratory or heart disease, the elderly and children are the groups most at risk. |
| PM10 | People with respiratory disease are the group most at risk. |
| CO | People with heart disease are the group most at risk. |
| SO2 | People with asthma are the group most at risk. |
| NO2 | Children and people with respiratory disease are the groups most at risk. |
ii. When appropriate, your AQI report may also contain the following:
a. Appropriate health and cautionary statements.
b. The name and index value for other pollutants, particularly those with an index value greater than 100.
c. The index values for sub-areas of your MSA.
d. Causes for unusual AQI values.
e. Actual pollutant concentrations.
5. Is My AQI Report for My MSA Only?
Generally, your AQI report applies to your MSA only. However, if a significant air quality problem exists (AQI greater than 100) in areas significantly impacted by your MSA but not in it (for example, O3 concentrations are often highest downwind and outside an urban area), you should identify these areas and report the AQI for these areas as well.
6. How Do I Get My AQI Report to the Public?
You must furnish the daily report to the appropriate news media (radio, television, and newspapers). You must make the daily report publicly available at one or more places of public access, or by any other means, including a recorded phone message, a public Internet site, or facsimile transmission. When the AQI value is greater than 100, it is particularly critical that the reporting to the various news media be as extensive as possible. At a minimum, it should include notification to the media with the largest market coverages for the area in question.
7. How Often Must I Report the AQI?
You must report the AQI at least 5 days per week. Exceptions to this requirement are in section 8 of this appendix.
8. May I Make Exceptions to These Reporting Requirements?
i. If the index value for a particular pollutant remains below 50 for a season or year, then you may exclude the pollutant from your calculation of the AQI in section 12.
ii. If all index values remain below 50 for a year, then you may report the AQI at your discretion. In subsequent years, if pollutant levels rise to where the AQI would be above 50, then the AQI must be reported as required in sections 3, 4, 6, and 7 of this appendix.
Calculation
9. How does the AQI relate to air pollution levels?
For each pollutant, the AQI transforms ambient concentrations to a scale from 0 to 500. The AQI is keyed as appropriate to the national ambient air quality standards (NAAQS) for each pollutant. In most cases, the index value of 100 is associated with the numerical level of the short-term standard (i.e., averaging time of 24-hours or less) for each pollutant. The index value of 50 is associated with the numerical level of the annual standard for a pollutant, if there is one, at one-half the level of the short-term standard for the pollutant, or at the level at which it is appropriate to begin to provide guidance on cautionary language. Higher categories of the index are based on increasingly serious health effects and increasing proportions of the population that are likely to be affected. The index is related to other air pollution concentrations through linear interpolation based on these levels. The AQI is equal to the highest of the numbers corresponding to each pollutant. For the purposes of reporting the AQI, the sub-indexes for PM10 and PM2.5 are to be considered separately. The pollutant responsible for the highest index value (the reported AQI) is called the “critical” pollutant.
10. What monitors should I use to get the pollutant concentrations for calculating the AQI?
You must use concentration data from State/Local Air Monitoring Station (SLAMS) or parts of the SLAMS required by 40 CFR 58.10 for each pollutant except PM. For PM, calculate and report the AQI on days for which you have measured air quality data (e.g., from continuous PM2.5 monitors required in Appendix D to this part). You may use PM measurements from monitors that are not reference or equivalent methods (for example, continuous PM10 or PM2.5 monitors). Detailed guidance for relating non-approved measurements to approved methods by statistical linear regression is referenced in section 13 below.
11. Do I Have to Forecast the AQI?
You should forecast the AQI to provide timely air quality information to the public, but this is not required. If you choose to forecast the AQI, then you may consider both long-term and short-term forecasts. You can forecast the AQI at least 24-hours in advance using the most accurate and reasonable procedures considering meteorology, topography, availability of data, and forecasting expertise. The document “Guideline for Developing an Ozone Forecasting Program” (the Forecasting Guidance) will help you start a forecasting program. You can also issue short-term forecasts by predicting 8-hour ozone values from 1-hour ozone values using methods suggested in the Reporting Guidance, “Guideline for Public Reporting of Daily Air Quality.”
12. How do I calculate the AQI?
i. The AQI is the highest value calculated for each pollutant as follows:
a. Identify the highest concentration among all of the monitors within each reporting area and truncate as follows:
(1) Ozone—truncate to 3 decimal places
PM2.5—truncate to 1 decimal place
PM10—truncate to integer
CO—truncate to 1 decimal place
SO2—truncate to integer
NO2—truncate to integer
(2) [Reserved]
b. Using Table 2, find the two breakpoints that contain the concentration.
c. Using Equation 1, calculate the index.
d. Round the index to the nearest integer.
Table 2—Breakpoints for the AQI
| These breakpoints | Equal these AQI's | |||||||
|---|---|---|---|---|---|---|---|---|
| O3 (ppm)
8-hour |
O3 (ppm)
1-hour1 |
PM2.5
(µg/m3) 24-hour |
PM10
(µg/m3) 24-hour |
CO
(ppm) 8-hour |
SO2
(ppb) 1-hour |
NO2
(ppb) 1-hour |
AQI | Category |
| 0.000-0.054 | — | 0.0—12.0 | 0-54 | 0.0-4.4 | 0-35 | 0-53 | 0-50 | Good. |
| 0.055-0.070 | — | 12.1—35.4 | 55-154 | 4.5-9.4 | 36-75 | 54-100 | 51-100 | Moderate. |
| 0.071-0.085 | 0.125-0.164 | 35.5—55.4 | 155-254 | 9.5-12.4 | 76-185 | 101-360 | 101-150 | Unhealthy for Sensitive Groups. |
| 0.086-0.105 | 0.165-0.204 | 3 55.5—150.4 | 255-354 | 12.5-15.4 | 4 186-304 | 361-649 | 151-200 | Unhealthy. |
| 0.106-0.200 | 0.205-0.404 | 3 150.5—250.4 | 355-424 | 15.5-30.4 | 4 305-604 | 650-1249 | 201-300 | Very Unhealthy. |
| 0.201-(2) | 0.405-0.504 | 3 250.5—350.4 | 425-504 | 30.5-40.4 | 4 605-804 | 1250-1649 | 301-400 | Hazardous. |
| (2) | 0.505-0.604 | 3 350.5—500.4 | 505-604 | 40.5-50.4 | 4 805-1004 | 1650-2049 | 401-500 | |
ii. If the concentration is equal to a breakpoint, then the index is equal to the corresponding index value in Table 2. However, Equation 1 can still be used. The results will be equal. If the concentration is between two breakpoints, then calculate the index of that pollutant with Equation 1. You must also note that in some areas, the AQI based on 1-hour O3 will be more precautionary than using 8-hour values (see footnote 1 to Table 2). In these cases, you may use 1-hour values as well as 8-hour values to calculate index values and then use the maximum index value as the AQI for O3.

Where:
Ip = the index value for pollutantp
Cp = the truncated concentration of pollutantp
BPHi = the breakpoint that is greater than or equal to Cp
BPLo = the breakpoint that is less than or equal to Cp
IHi = the AQI value corresponding to BPHi
Ilo = the AQI value corresponding to BPLo.
iii. If the concentration is larger than the highest breakpoint in Table 2 then you may use the last two breakpoints in Table 2 when you apply Equation 1.
Example
iv. Using Table 2 and Equation 1, calculate the index value for each of the pollutants measured and select the one that produces the highest index value for the AQI. For example, if you observe a PM10 value of 210 µg/m3, a 1-hour O3 value of 0.156 ppm, and an 8-hour O3 value of 0.130 ppm, then do this:
a. Find the breakpoints for PM10 at 210 µg/m3 as 155 µg/m3 and 254 µg/m3, corresponding to index values 101 and 150;
b. Find the breakpoints for 1-hour O3 at 0.156 ppm as 0.125 ppm and 0.164 ppm, corresponding to index values 101 and 150;
c. Find the breakpoints for 8-hour O3 at 0.130 ppm as 0.116 ppm and 0.374 ppm, corresponding to index values 201 and 300;
d. Apply Equation 1 for 210 µg/m3, PM10:

e. Apply Equation 1 for 0.156 ppm, 1-hour O3:

f. Apply Equation 1 for 0.130 ppm, 8-hour O3:

g. Find the maximum, 206. This is the AQI. The minimal AQI report would read:
v. Today, the AQI for my city is 206 which is Very Unhealthy, due to ozone. Children and people with asthma are the groups most at risk.
13. What additional information should I know?
The EPA has developed a computer program to calculate the AQI for you. The program prompts for inputs, and it displays all the pertinent information for the AQI (the index value, color, category, sensitive group, health effects, and cautionary language). The EPA has also prepared a brochure on the AQI that explains the index in detail (The Air Quality Index), Reporting Guidance (Technical Assistance Document for the Reporting of Daily Air Quality—the Air Quality Index (AQI)) that provides associated health effects and cautionary statements, and Forecasting Guidance (Guideline for Developing an Ozone Forecasting Program) that explains the steps necessary to start an air pollution forecasting program. You can download the program and the guidance documents at www.airnow.gov. Reference for relating non-approved PM measurements to approved methods (Eberly, S., T. Fitz-Simons, T. Hanley, L. Weinstock., T. Tamanini, G. Denniston, B. Lambeth, E. Michel, S. Bortnick. Data Quality Objectives (DQOs) For Relating Federal Reference Method (FRM) and Continuous PM2.5 Measurements to Report an Air Quality Index (AQI). U.S. Environmental Protection Agency, Research Triangle Park, NC. EPA-454/B-02-002, November 2002) can be found on the Ambient Monitoring Technology Information Center (AMTIC) Web site, http://www.epa.gov/ttnamti1/.
[64 FR 42547, Aug. 4, 1999, as amended at 73 FR 16513, Mar. 27, 2008; 75 FR 6537, Feb. 9, 2010; 75 FR 35602, June 22, 2010; 78 FR 3286, Jan. 15, 2013; 80 FR 65468, Oct. 26, 2015]